|
⇤ ← Revision 1 as of 2010-12-16 10:33:57
Size: 1213
Comment:
|
Size: 2835
Comment:
|
| Deletions are marked like this. | Additions are marked like this. |
| Line 16: | Line 16: |
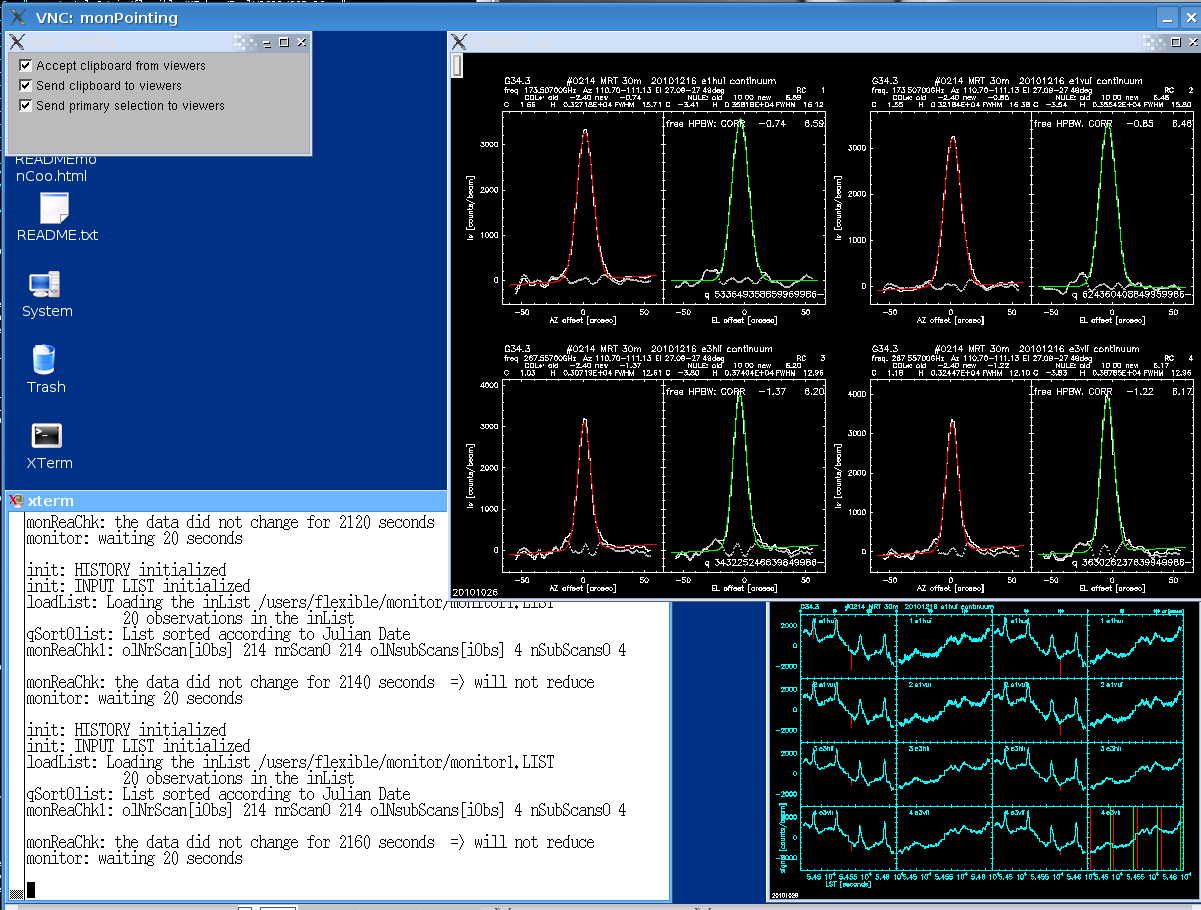
| {{attachment:heterodine-o.png}} This figure shows the normal display of the monitor. From this snapshot we can see that the last pointing was done on G34.3, using the bands E1 and E3, at freq. 173.507GHz and 267.557 GH, 2160 seconds ago, the scan was the 214 and it consisted on 4 subscans. There were some spikes. We can also see the previous pointing and focus corrections and the elevation and azimuth of the source. |
|
| Line 23: | Line 32: |
| {{attachment:mopsic-display03.png}} |
|
| Line 27: | Line 38: |
| {{attachment:screen1.png}} * Upper left: on-off RA/DEC map of all pixels. The RA/DEC 0/0 denotes the reference pixel for pointing. * Upper right: center pixel (53): before/after skynoise reduction, i.e. correlated signal filter (CSF, red/green) * Lower left: * A star denotes the result of the last sky dips, i.e. the sky emissivity at the source elevation CHECK * Output of 3 DC pixels to check for changes in the sky emissivity * upper: line of sight (los) opacity (showing elevation effect and others) * lower: total power * Lower center: * noise in the data before/after the CSF (the plot before is/will be overplotted with the noise after the CSF, in this particular case the rms in the data after CSF is visible, the numbers above the plot 49.5/51mJy/beam give the rms values of the high frequency noise component) * gain 1 (in this particular case) * col*/nule/sfcz, i.e. pointing and focus offsets * throw 32", period 520msec, rotator angle 0 * Lower right: time series of 4 pixels (51, 52, 53, 54), before and after sky noise subtraction |
|
| Line 29: | Line 56: |
| * MAMBO2 Skydip | |
| Line 30: | Line 58: |
| {{attachment:mopsic-display02.png}} |
Contents
Back to Pool page: PoolObserving
In this wiki we aim to create a guide of the info displayed by the different monitors running at the telescope. The monitors Mopsic Monitor, and MonCoo must be running always at the telescope. The only exception is in case of maintenance time, when the version of mopsic can be changed, or doing Absorber measurements with MAMBO2 in stow position (in which case the mopsic monitor must be replaced by the MonInst monitor).
MOPSIC MONITOR
This monitor displays and reduces all the observations of the bolometer MAMBO2 and continuum data from heterodyne receivers. The vncviewer port of this monitor is the 27.
Information displayed
* General Info 
This figure shows the normal display of the monitor.
From this snapshot we can see that the last pointing was done on G34.3, using the bands E1 and E3, at freq. 173.507GHz and 267.557 GH, 2160 seconds ago, the scan was the 214 and it consisted on 4 subscans. There were some spikes. We can also see the previous pointing and focus corrections and the elevation and azimuth of the source.
* Heterodyne pointing
* Heterodyne focus
* MAMBO2 Pointing
* MAMBO2 Focus
* MAMBO2 Onoff
- Upper left: on-off RA/DEC map of all pixels. The RA/DEC 0/0 denotes the reference pixel for pointing.
- Upper right: center pixel (53): before/after skynoise reduction, i.e. correlated signal filter (CSF, red/green)
- Lower left:
- A star denotes the result of the last sky dips, i.e. the sky emissivity at the source elevation CHECK
- Output of 3 DC pixels to check for changes in the sky emissivity
- upper: line of sight (los) opacity (showing elevation effect and others)
- lower: total power
- Lower center:
- noise in the data before/after the CSF (the plot before is/will be overplotted with the noise after the CSF, in this particular case the rms in the data after CSF is visible, the numbers above the plot 49.5/51mJy/beam give the rms values of the high frequency noise component)
- gain 1 (in this particular case)
- col*/nule/sfcz, i.e. pointing and focus offsets
- throw 32", period 520msec, rotator angle 0
- Lower right: time series of 4 pixels (51, 52, 53, 54), before and after sky noise subtraction
* MAMBO2 Map
* MAMBO2 Skydip
Indication of Problems
- Monitor stacked
- New data not shown
- Signal Jumps
- Spikes
- Error Messages
COORDINATES MONITOR
Information displayed
Indication of Problems
= INSTABILITIES MONITOR ==
Information displayed
