Back to Pool page: PoolObserving
In this wiki we aim to create a guide of the info displayed by the different monitors running at the telescope. The monitors Mopsic Monitor, and MonCoo must be running always at the telescope. The only exception is in case of maintenance time, when the version of mopsic can be changed, or doing Absorber measurements with MAMBO2 in stow position (in which case the mopsic monitor must be replaced by the MonInst monitor).
It is recommended to have a look to the plots prior to reading the explanation, and try to understand them, in order to get a more fluent training in the monitors.
MOPSIC MONITOR
This monitor displays and reduces all the observations of the bolometer MAMBO2 and continuum data from heterodyne receivers. The vncviewer port of this monitor is the 27.
Information displayed
General Info
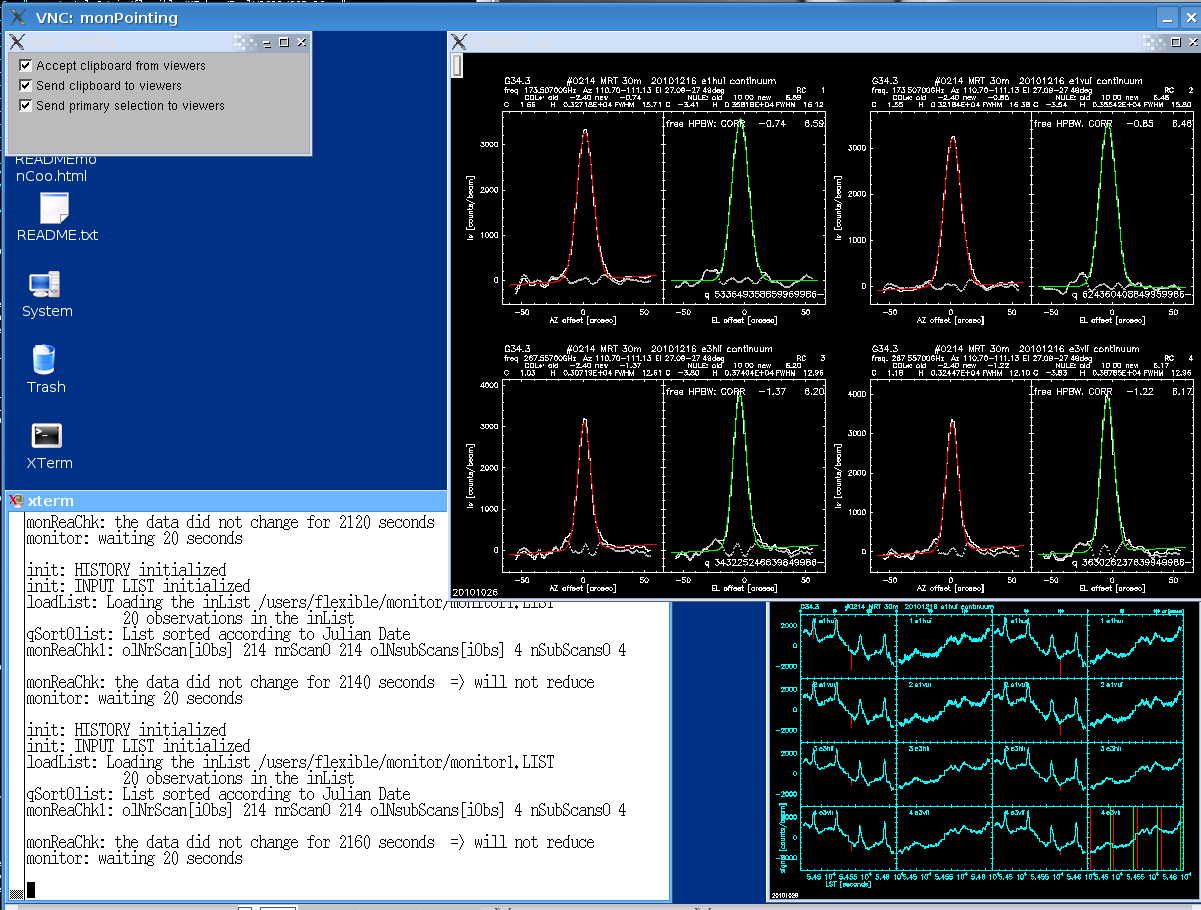
This figure shows the normal display of the monitor.
From this snapshot we can see that the last pointing was done on G34.3, using the bands E1 and E3, at freq. 173.507GHz and 267.557 GH, 2160 seconds ago, the scan was the 214 and it consisted on 4 subscans. There were some spikes. We can also see the previous pointing and focus corrections and the elevation and azimuth of the source. All this information and more is shown in the monitor. Where all these is would be explained in the following lines. However, before reading futher, I recommend you to have a first look to the snapshot and try to locate this info by yourselves.
All the panels showed by the monitor display at their top the same info in the same order: SOURCE #SCAN TELESCOPE DATE FRONTEND BACKEND. This stands for all the monitors
In the shell where the monitor was launched, it can be read how long the data has not changed. This means that during this time no continuum data, with EMIR, HERA or MAMBO2 has been taken. This can be used to see if the data is created. For instance, in case MAMBO is used and the monitor does not show the new data, this would mean that the fits are not being created, which could point towards an ABBA failure.
 Note that a certain scan would only be shown once at least the first subscan has finished.
 - In the shell where the monitor was launched, it can be read also, the scan number, the number of subscans done.
In any panel of the monitors showing the signal against time (e.g. the bottom-right window in the previous plot) a vertical red line denotes the start of a subscan, while a green line denotes the end of it. Any problem of those described below that happens between a green and a red line in the signal plot can be ignored, since it happened between subscan, i.e. does not affect the data.This stands for all the monitors
Heterodyne
TBC
MAMBO2
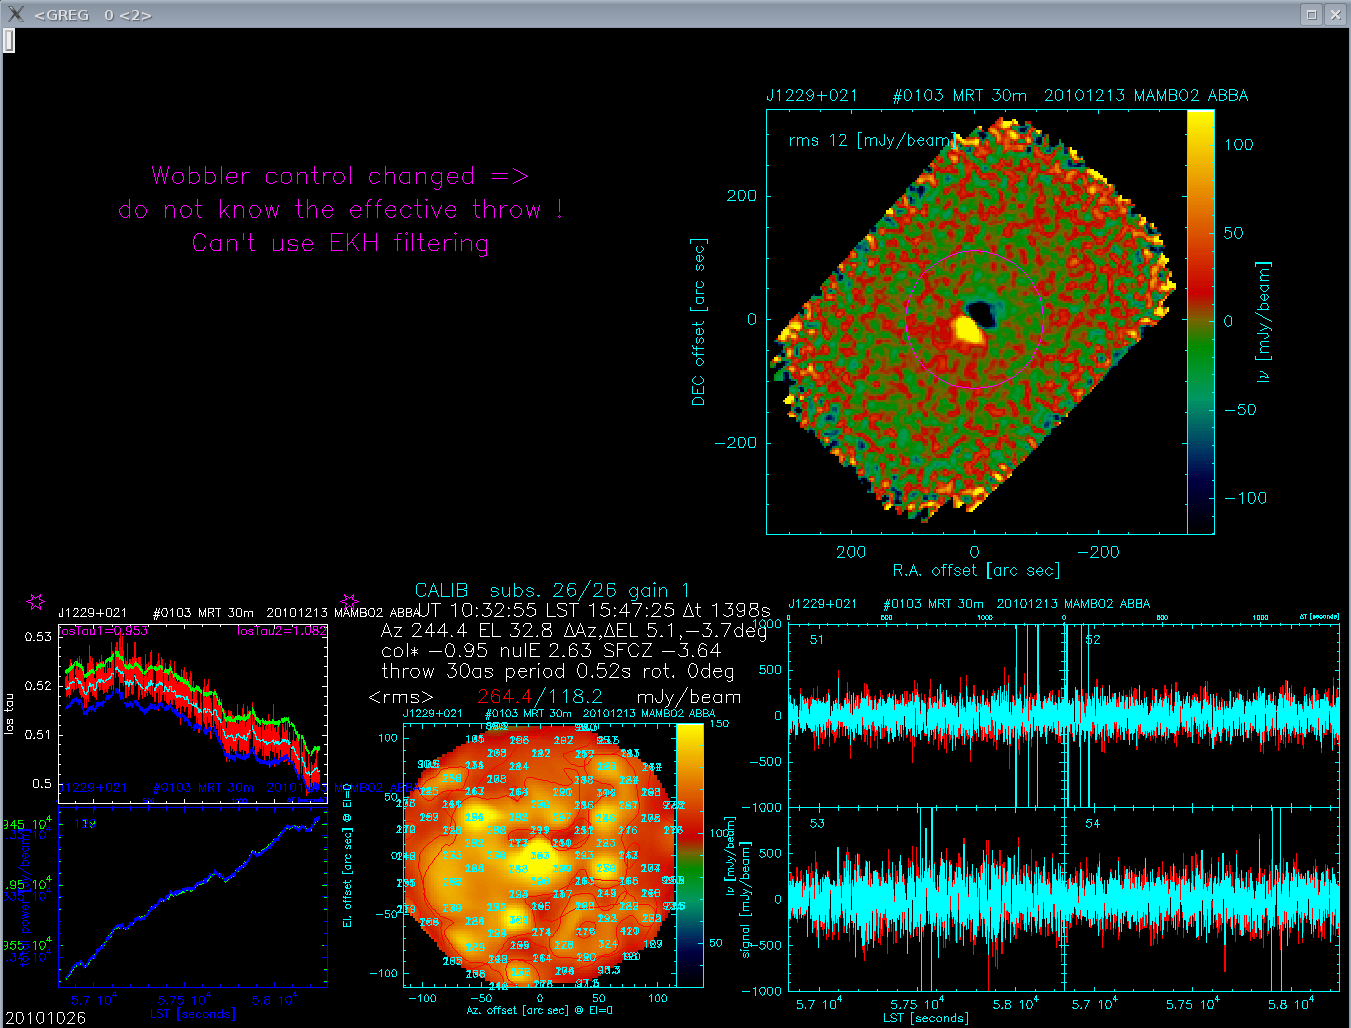
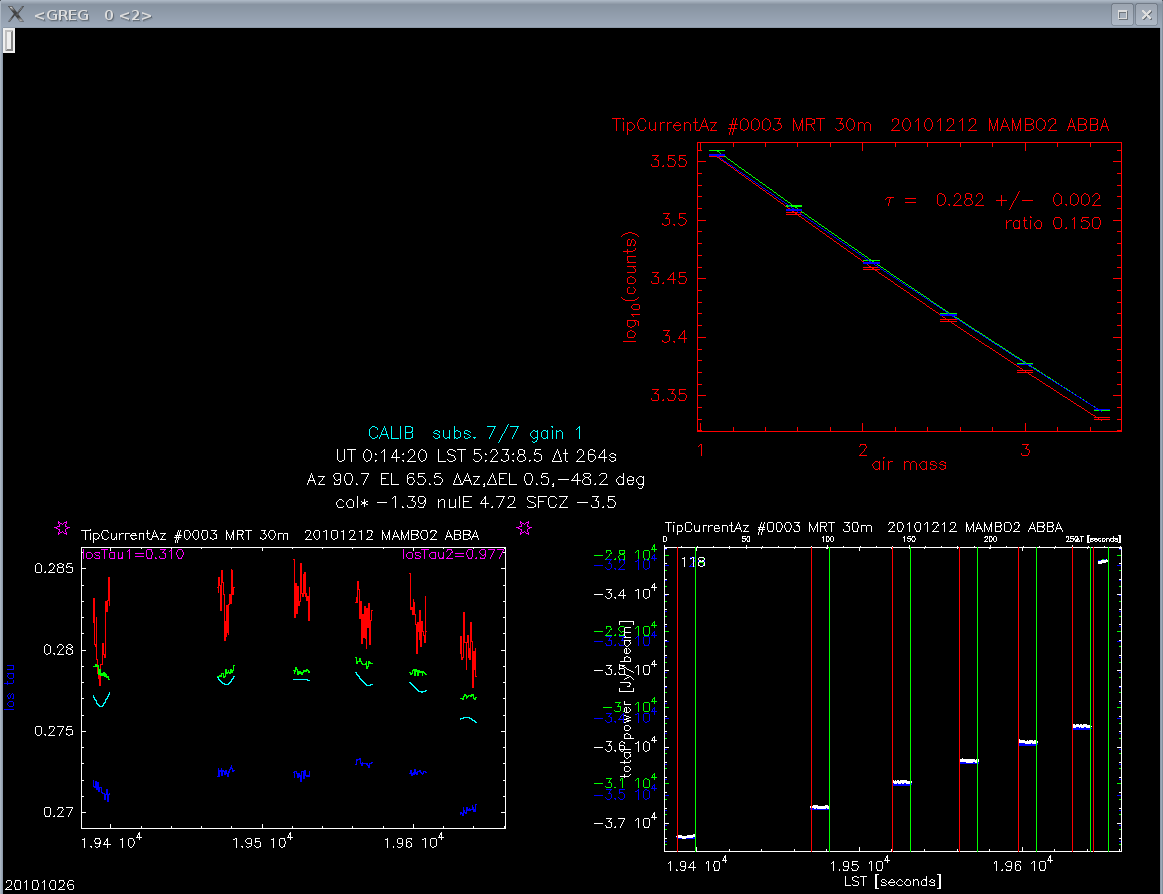
In general, expect of the skydips, the bolometer plots are always divided in 5 panels, and a central section with the information of the observation. From top to bottom and left to right the panels are:
- For pointing and focus shows the fitting. For on-off and maps it shows the reduced map.
- For pointing and focus shows the map of the signal observed with MAMBO. For pointings shows the signal .vs time result of the reference pixel with the flux and rms. For maps the double beam map with the rms.
- Total power panels. The upper panel show the variation of the opacity in the line of sight along the observation. The stars correspond to skydip measurements. For each of these measurements a value of the opacity in the line is plotter (e.g. losTau1). The red, green and dark blue lines correspond to the three total power channels of MAMBO2. The light blue shows an average of the other three lines. The bottom panel shows the change of the signal received by these total power channels, in Jy/beam.
It shows the a map of the rms for the different bolos. This is plotted twice, the first without filtering the correlated signal, which gives the mean rms shown in red in at the top of the panel, and then it overplots the rms map after filtering the correlated signal, which give a new mean rms show in blue at the top of this panel.
 In case it appears an increase of the rms in the righ-hand edge of the panel, the pool coordinator should be informed immediately (an example of this can be seen below).
 - Signal vs. time panel, showing the signal evolution for different included the reference one. The red signal corresponds to the raw signal, and the blue one with the signal after filtering the correlated noise.
In the central section, it can be found from left to right ordered by line from top to bottom the following info :
- Project , Number of subscans done and commanded, Gain used
- UT time of the observation, LST time of the observation, Scan duration
- Azimuth, Elevation, Changes in Az. and El. along the scan.
- Corrections of pointing and focus corrections (col*, nulE, SFCZ)
- Wobbler info: throw commanded, wobbling period and rotation angle.
MAMBO2 Pointing
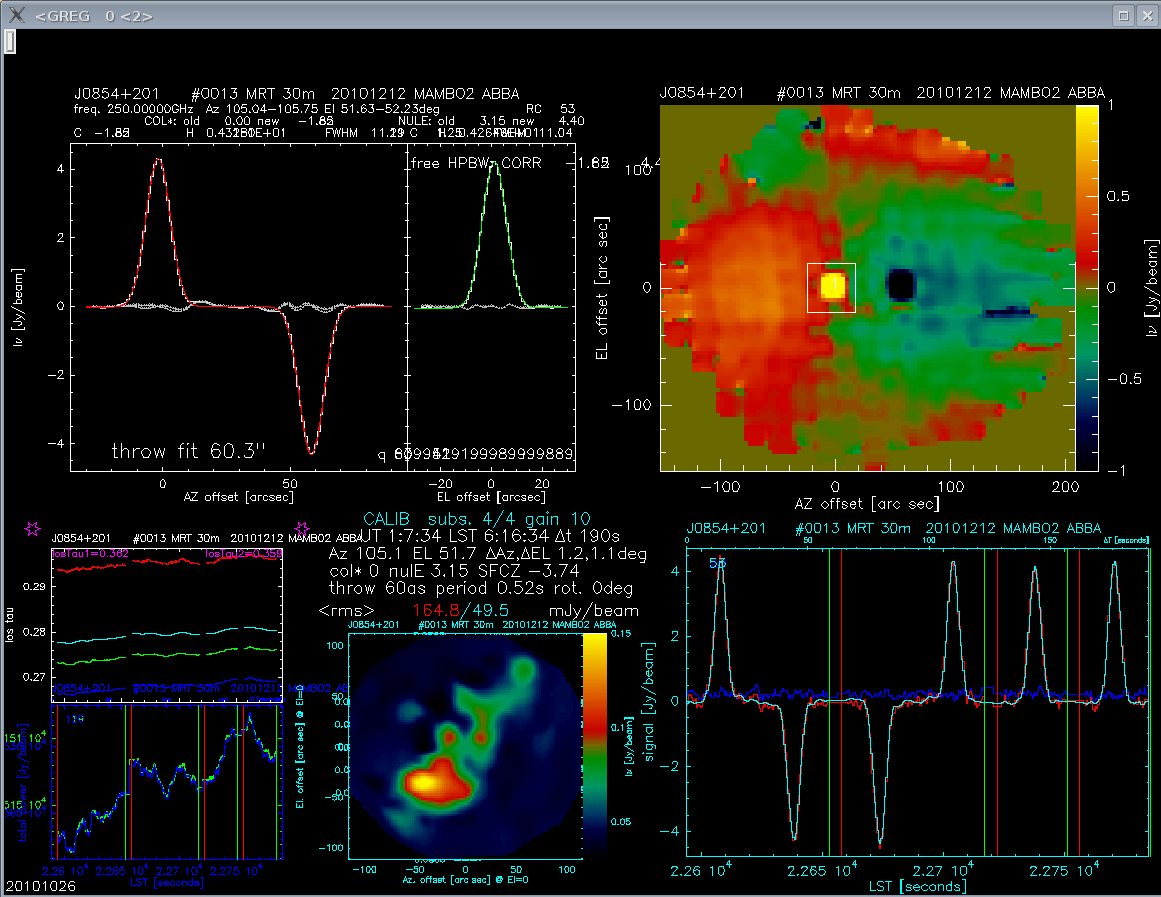
The screen is snapshot of a pointing. As mentioned the screen is divided in 5 panels and one info section. Here we will only discuss those aspects not covered already, panel by panel.
Here it is shown the result from the fitting of the pointing. Most of the info in this panel is the same as for the heterodyne pointings. For MAMBO2 all the pointings are done with wobbler switching, allowing us to fit the throw as the distance between the two gaussians in azimuth. This throw must be similar to that commanded (see info section). This, as well as the FWHM gives an idea of the quality of the pointing.
This map shows the double beam map obtained for MAMBO. We can see the source in positive and negative, as expected for the double beam (see panel 1.). Since the wobbling is done is az. one would expect to have, in addition to the source in positive and negative emission, two semicircles for the sky emission. This spillover is not this way, but is the best we have been able to obtain lately.
 In case this spillover changes, the Pool manager should be informed immediately.
 - Explained above.
- In case a strong source is observed it is normal to see a elongation of high noise in the center of this panel (if pixel 53 is used) or in the upper-left corner (if pixel 20).
- Explained above.
MAMBO2 Focus
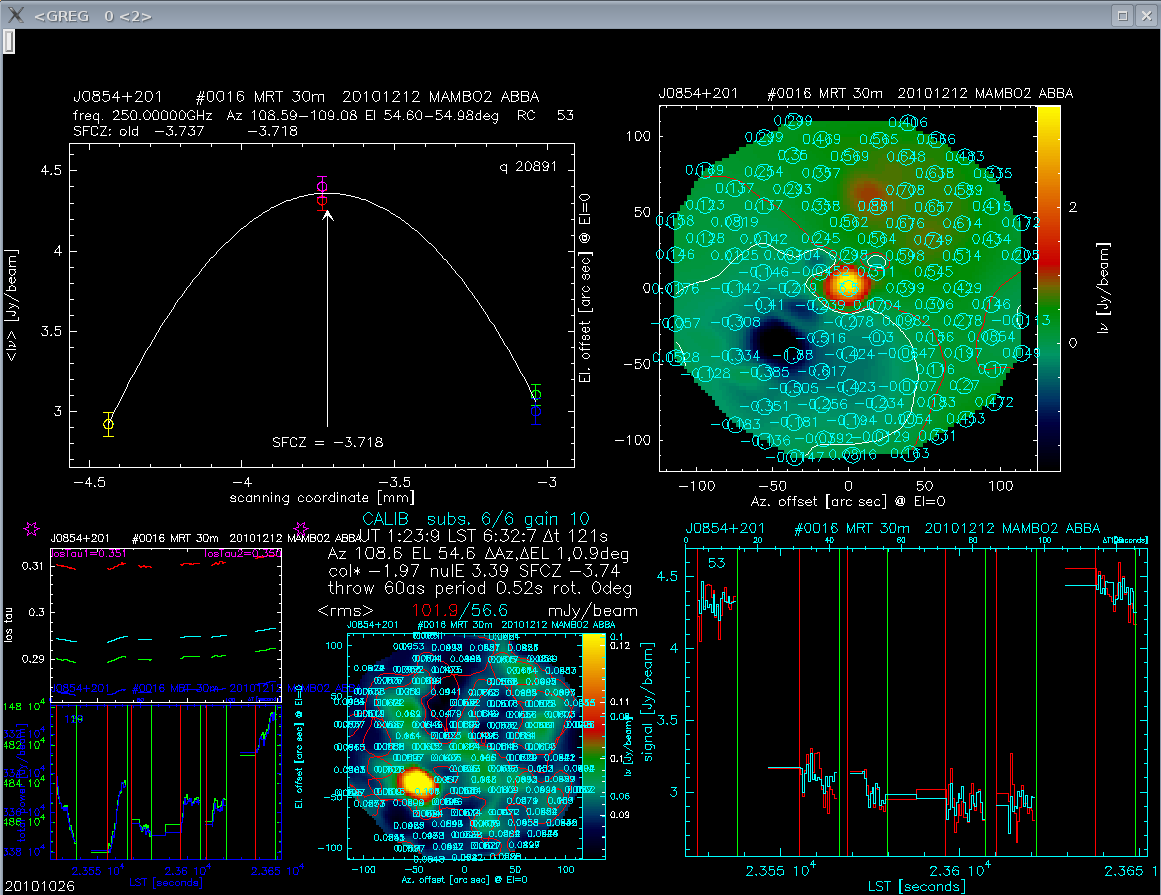
The screen is snapshot of a focus. All the info of the panels is already explained.
MAMBO2 Onoff
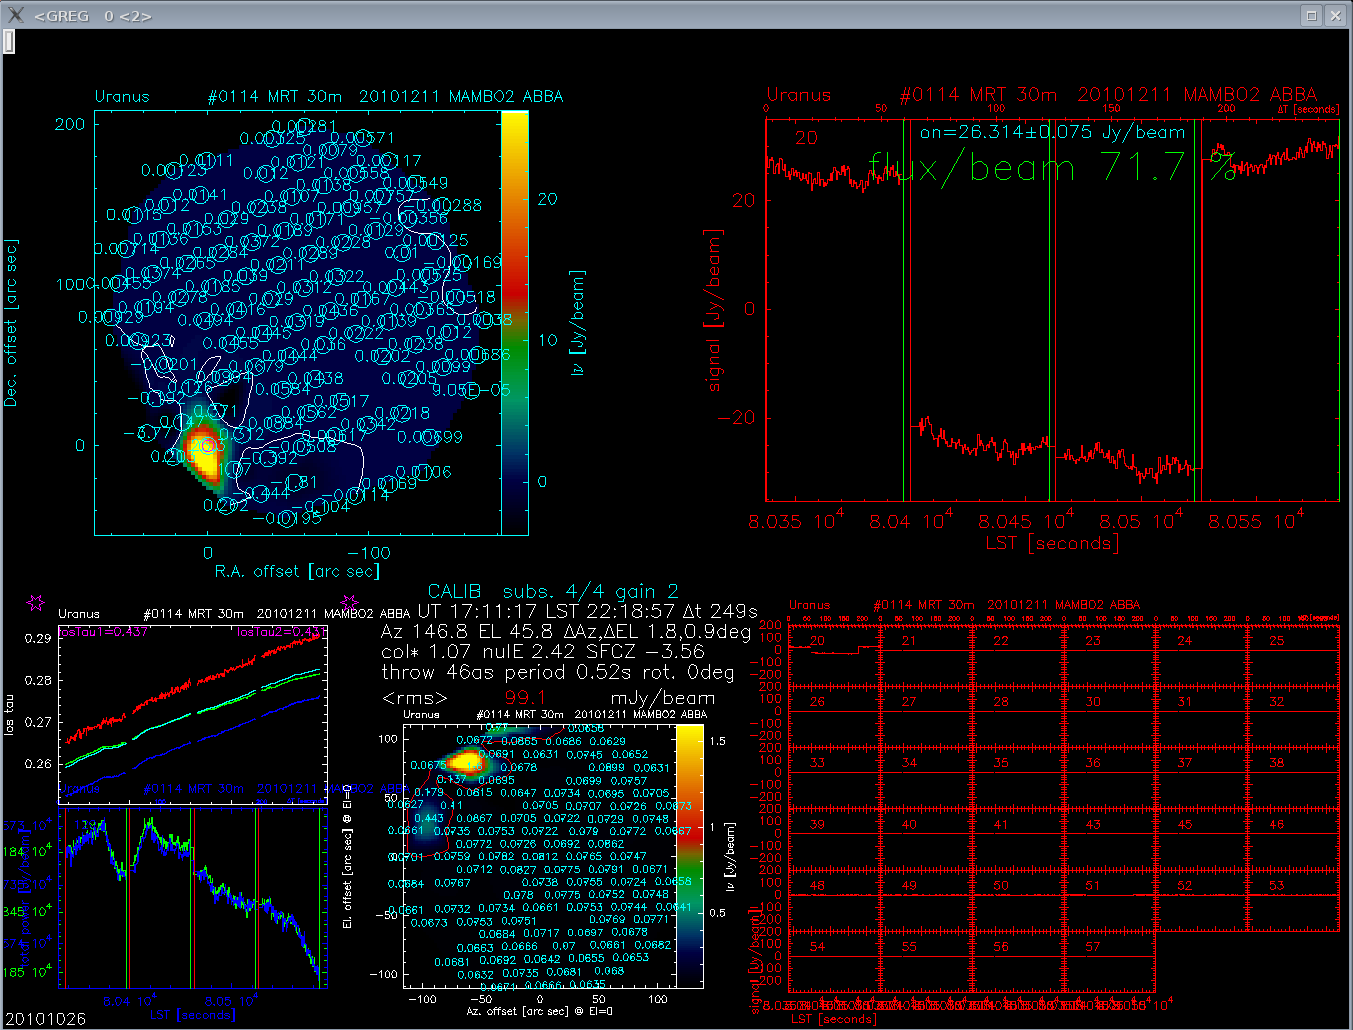
The screen is snapshot of an On-Off. The inf
- On-off RA/DEC map of all pixels. The RA/DEC 0/0 denotes the reference pixel.
As explained before, this maps shows the signal for the reference pixel. The positive-negative order is similar to what happens with the pointings. The source is observed in the four scans following the next sequence: on-off, off-on , off-on , on-off. The resulting flux and rms are shown in the upper part of the panel in blue. For the strong sources the skynoise reduction is not performed, and therefore no blue line is plotted. In case the source is a calibration source, it will be display in green the flux percentage of the observation.
 note that normal observations require a calibration above 80%. In case it is not this way a) MAMBO is losing sensitivity (warming up) or b) we are out of focus, pointing or bad calibrated (skydip).
 - E.a.
- E.a.
- E.a.
MAMBO2 Map
TBC
MAMBO2 Skydip
TBC
Indication of Problems
Monitor stacked
- This has never happened so far. In case it happens the procedure is kill the process, make sure that there is no other mopsic @ monitor running, remove the lockfile and restart the monitor.
New data not shown
- First, note that only once the first subscan of a certain scan has been observed it will appear in the monitors (mopsic monitor, monCoo or monInst). In case the data is not continuum it would appear in the monCoo, but not in the rest (see below).
In case the most recent continuum data is not shown the most probable problem is that the fits files are not being created. In case of MAMBO2, please check that ABBA is working properly.
Right Edge Problem
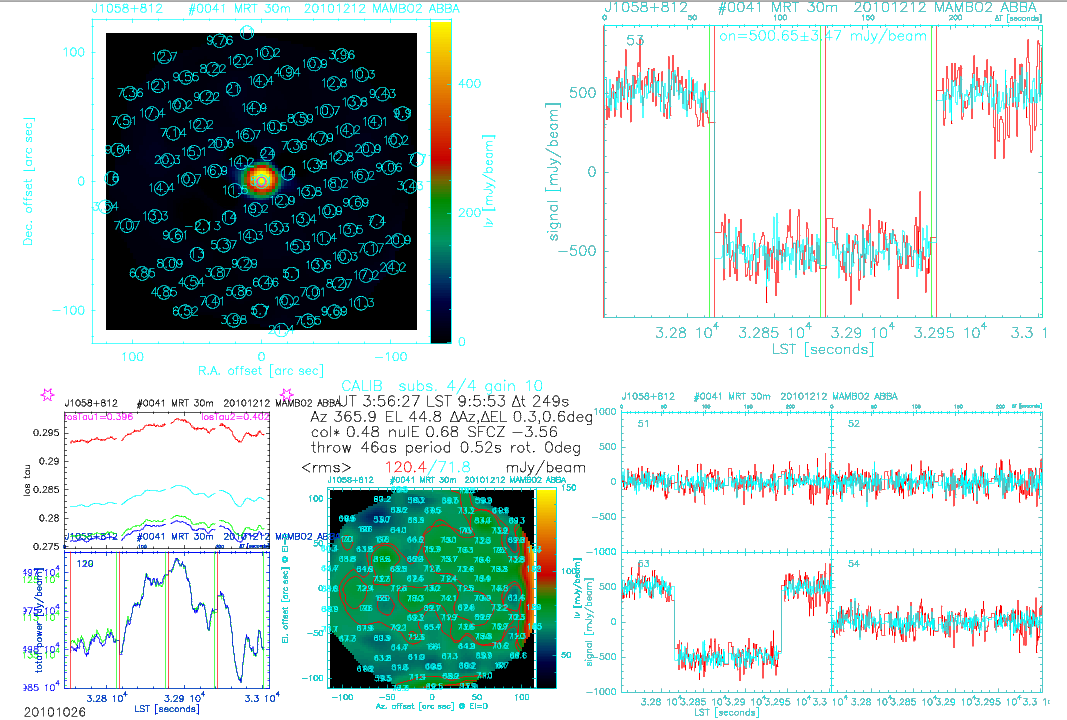
- This problem is an increase in the noise of the bolos at the right-hand edge of the bolometer. It is not clear the reason for this. Due to this, a fast reaction once it appears is fundamental to check the possible reasons. It is further explained in the section devoted to panel 4.
Signal Jumps
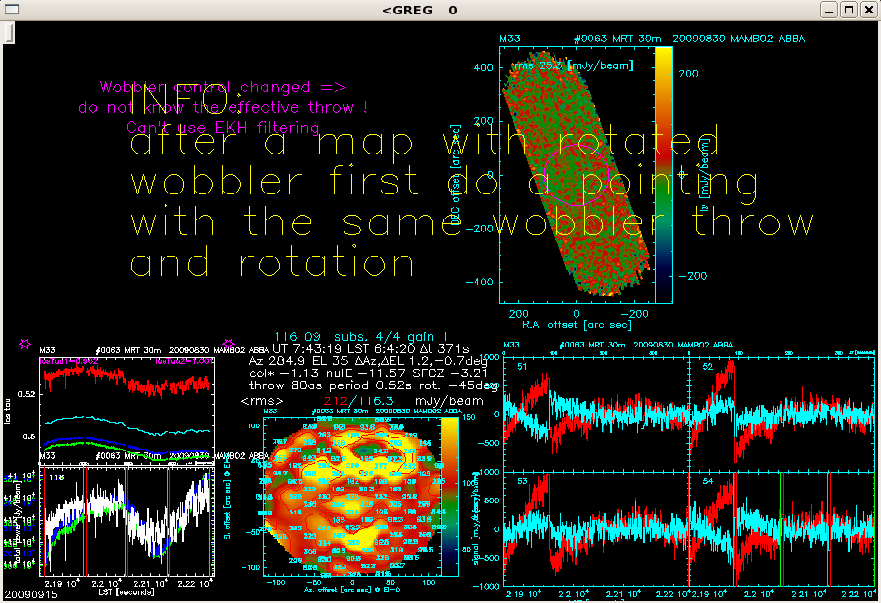
- This plot shows a map. It can be seen in the signal vs. time panels that there is a signal jump both in the raw signal and in the filtered one. There is not clear reason for this problem. In case this happens the Pool coordinator should be informed immediately.
Spikes
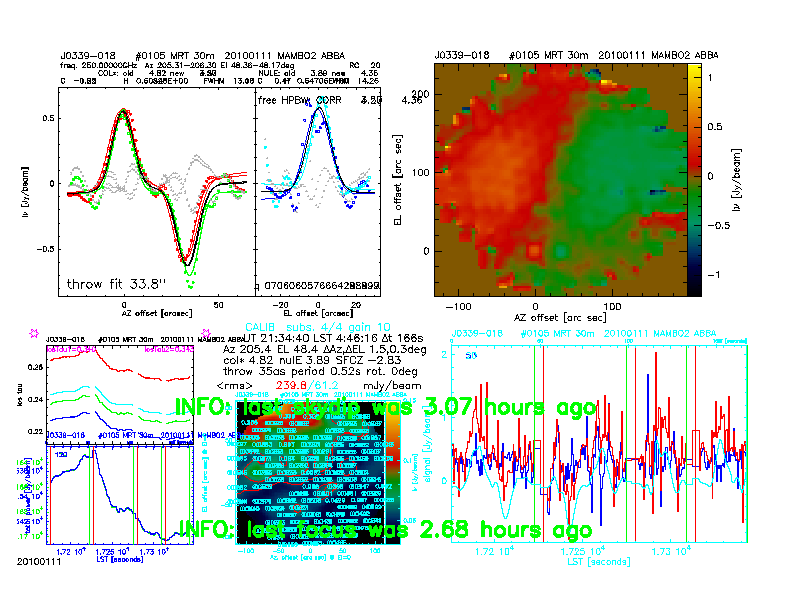
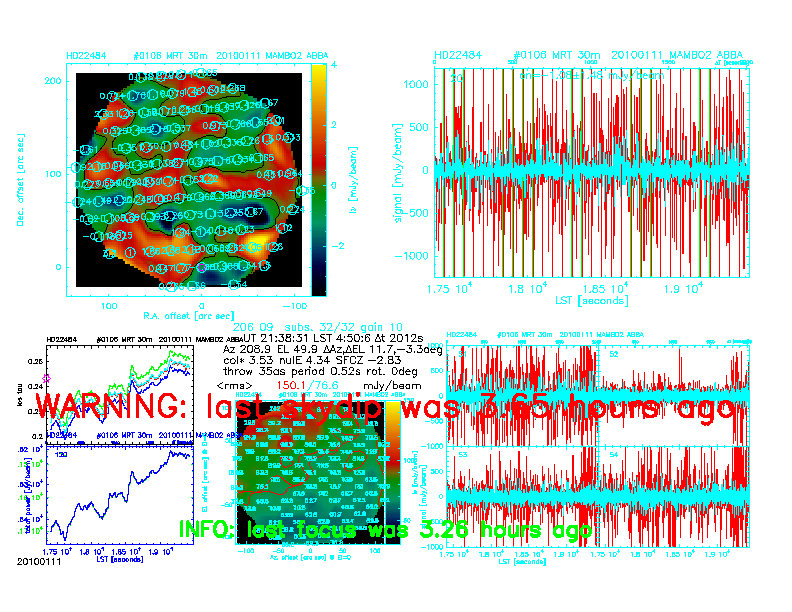
- Here are plotted two scans, a pointing and an onoff both showing clearly spikes in the signal vs. time panels.
In the past spikes appeared due to a water leak that affected the pre-amplifier of MAMBO. Now, there is a cover on the pre-amplifier to avoid such problem. In principle, anything crossing fast the optical path could cause an spike (e.g. a water drop). This was tested by GQ simulating leaks. It was also found that lease cable connection could cause spikes. In any case, if this problem appears, the Pool Coordinator should be informed immediately
Error Messages
- The monitor has error messages to alert the observer, AoD, Operator, of several problems or observations that need to be done. In general these messages are clear enough, so no explanation is needed. Here is a list of the Alert/error messages from mopsic.
- Last #calibration measurement# was done #time# ago
- MAMBO2 must be blind. Recycling time?!
- TBC
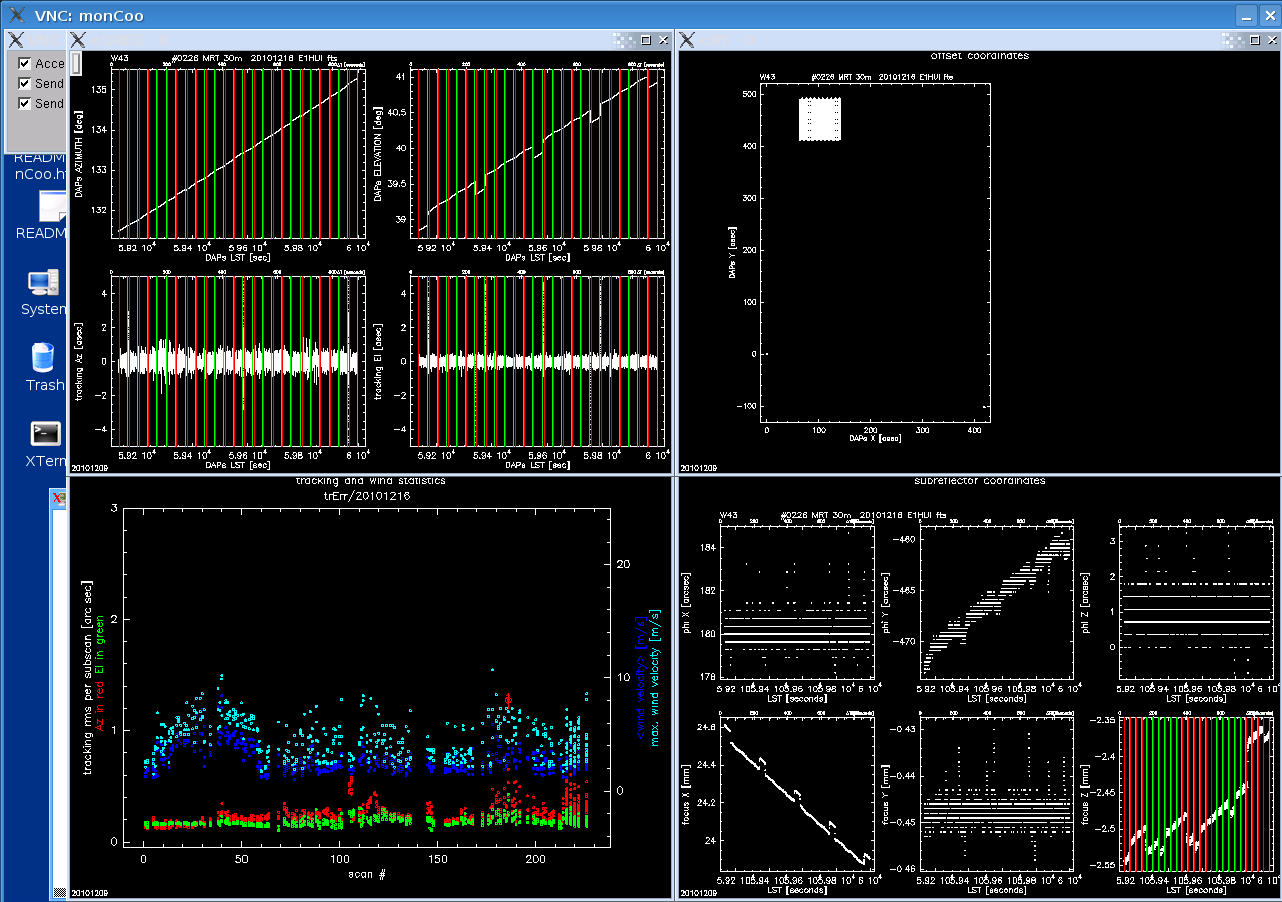
COORDINATES MONITOR
- TBC
Information displayed
Indication of Problems
INSTABILITIES MONITOR
Information displayed
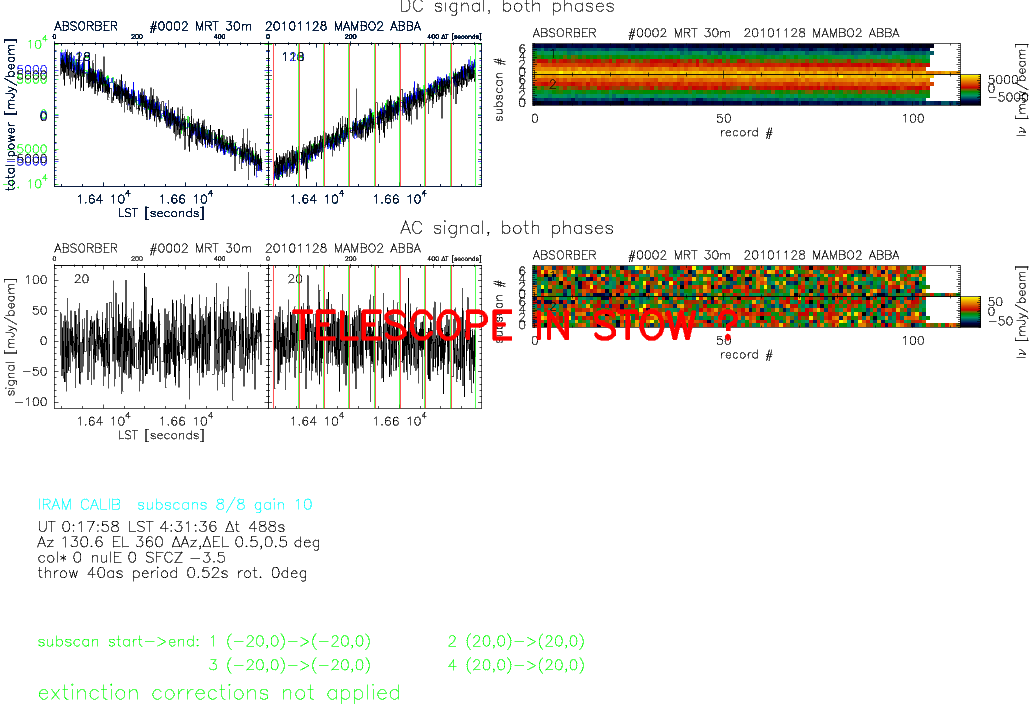
The plots shown by the monInst can be divided in two set of two panels, one for DC and another for AC, and the info section, common for all MAMBO plots.
The upper panels are devoted to DC signal. The left panel shows the phases of the observation (two for wobbler observations and one for total power observations). This signal can show slopes, but not jumps or changes in the slope. The right plot shows the variation of the intensity with the subscans.
The lower panels are devoted to AC signal of the reference pixel, as labeled in the upper-left corned of the signal vs. time plots. The AC signal must be flat, with a mean value of 0, and with an rms at least of 40 mJy/beam. This should be the rms under good conditions. The wind can shake the telescope and make this rms bigger. ![]() This is why is so important to comment on wind conditions while doing absorber measurements.
This is why is so important to comment on wind conditions while doing absorber measurements.
Indication of Problems
Spikes
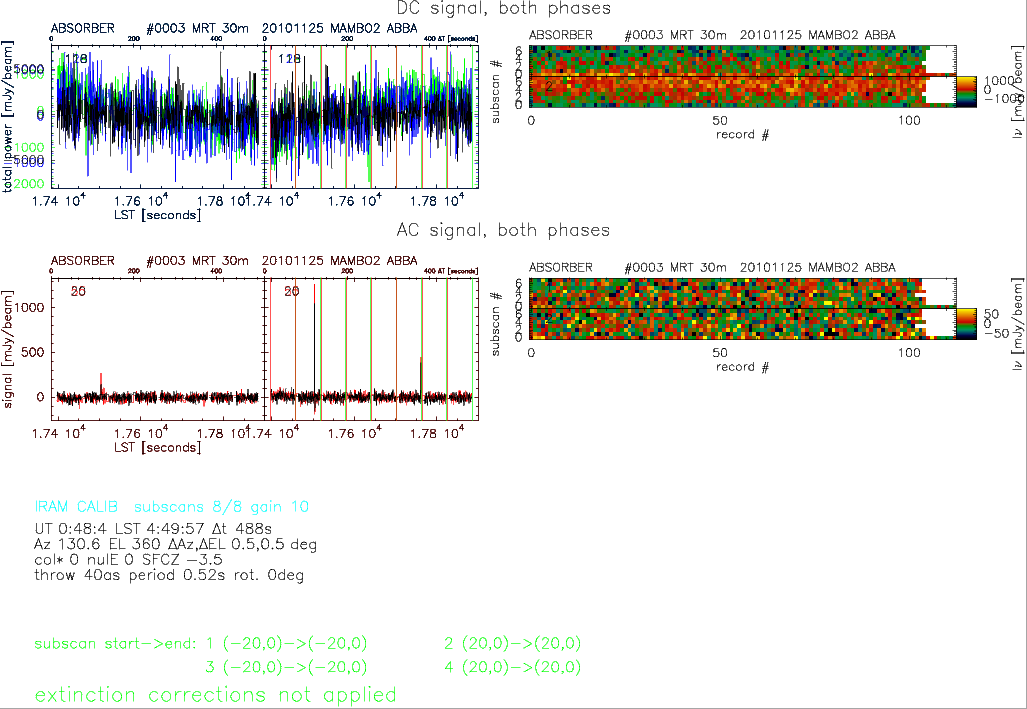
- The absorber can show spikes in AC. If the density of the spikes is high, and they appear in several scans the pool manager should be contacted. The reason for this can be that the absorber is not properly fixed.
Signal Jumps
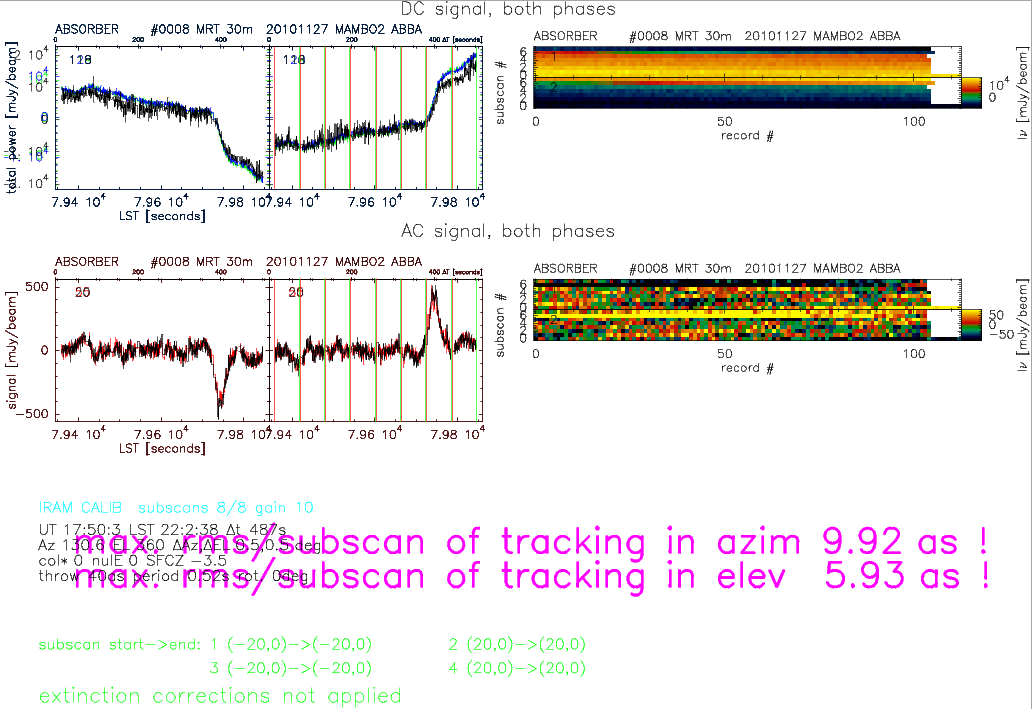
- This signal jump are consequence of jumps in the He3 temperature. Since this jumps are correlated (i.e. are seen by all the bolos) they can be removed. Therefore this is not a real problem.
Warming up
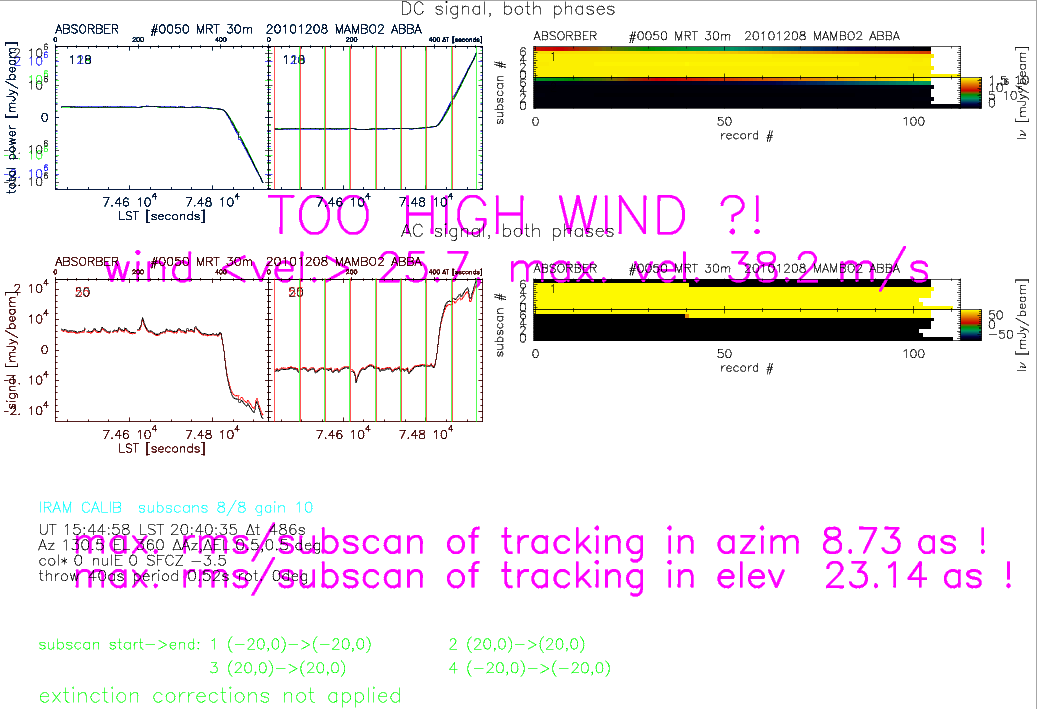
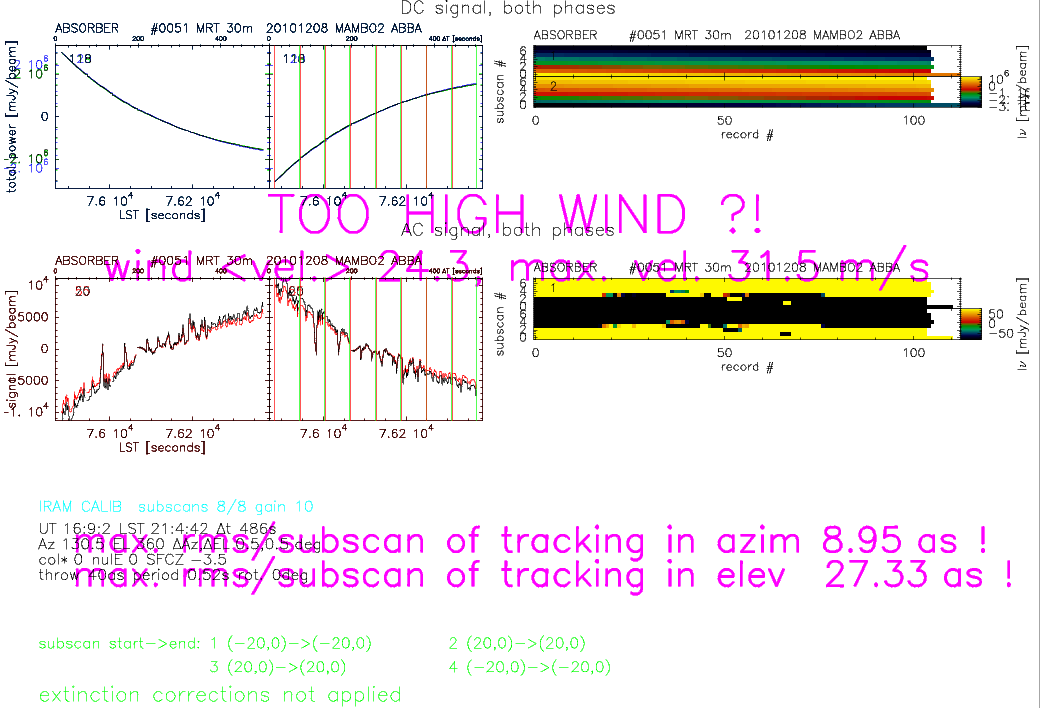
- In case MAMBO2 warms up we would see a large change in both AC and DC signals while it is warming up, as shown in the plots. Note that as mentioned the AC signal should be flat.
Warmed up
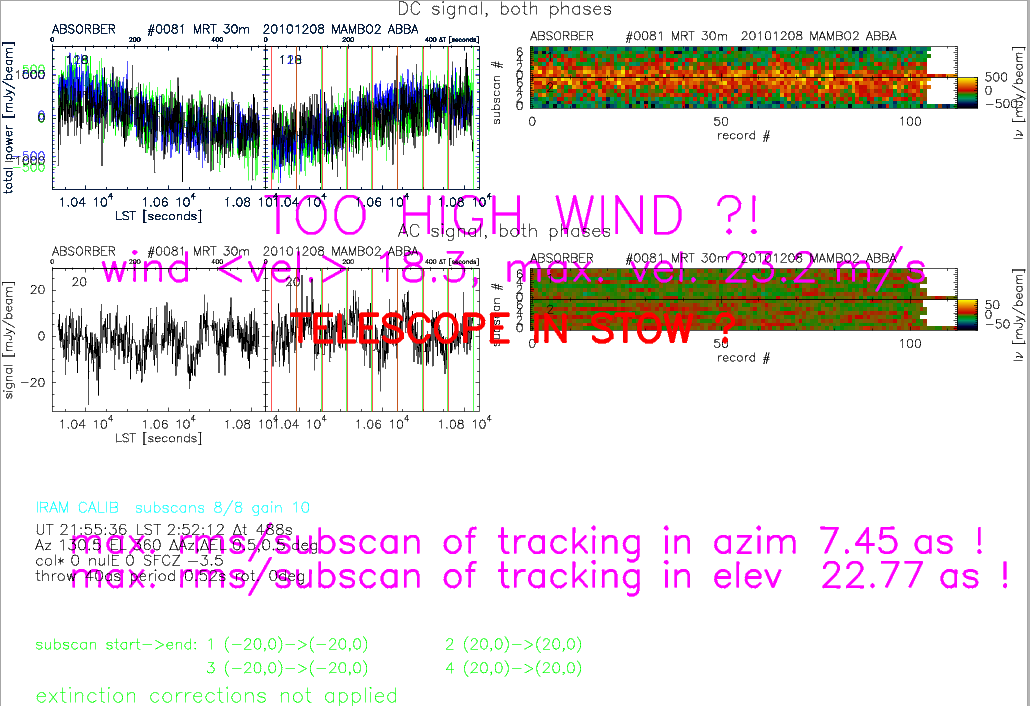
- Once the bolometer has warmed up, there are no slopes anymore. The way to notice this problem is then to check the rms of the AC signal. The rms has significantly decreased from the best value, which means that is wrong.
