Context: Trying to use large crosses to monitor the "Plateau". We look at the center reference pixel and for one scan, all other tones were switched off to check whether power on the feedline could be the source of the plateau
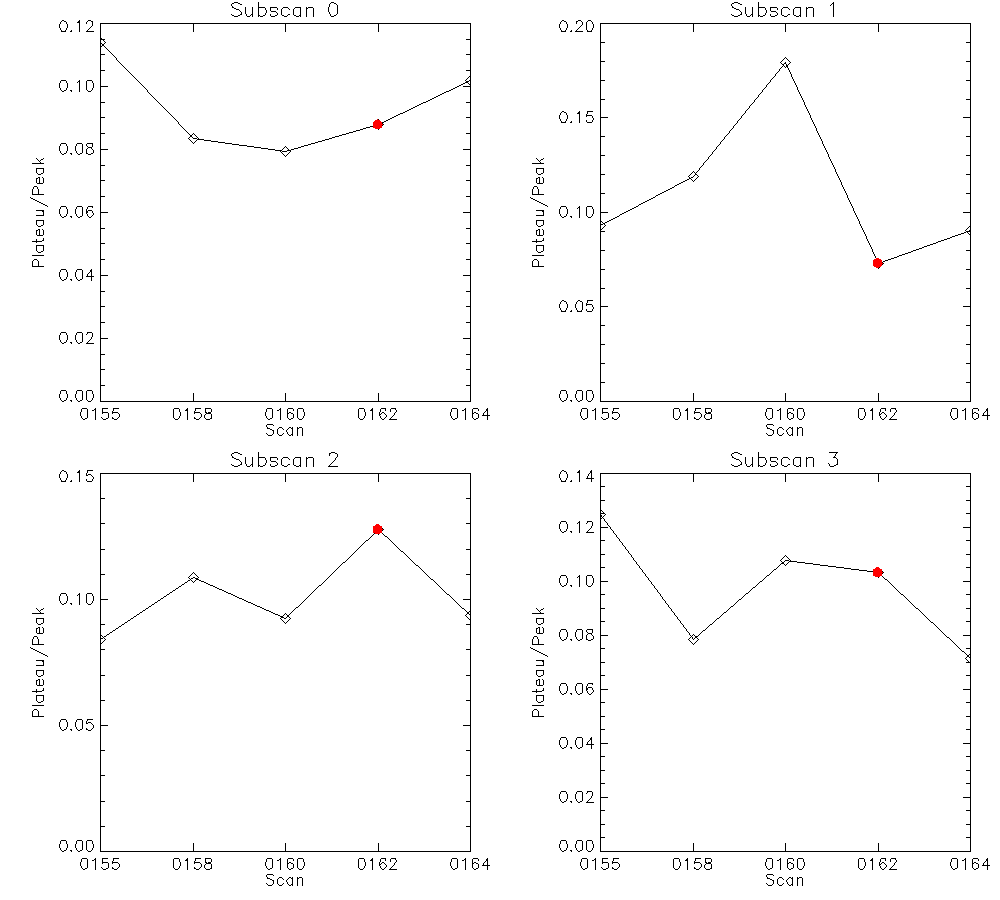
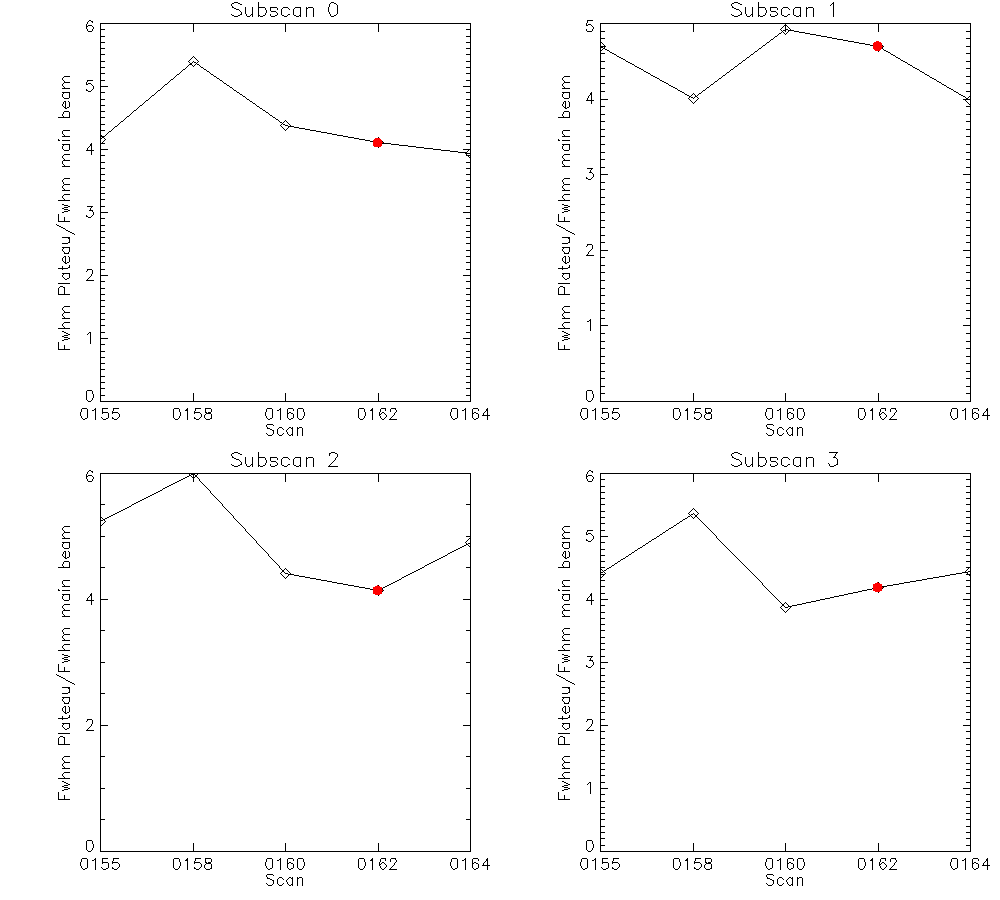
Summary: the plateau is seen, consistently (with pour statistics though, only 4 scans), with all tones on or off. The source of the plateau is therefore something else.
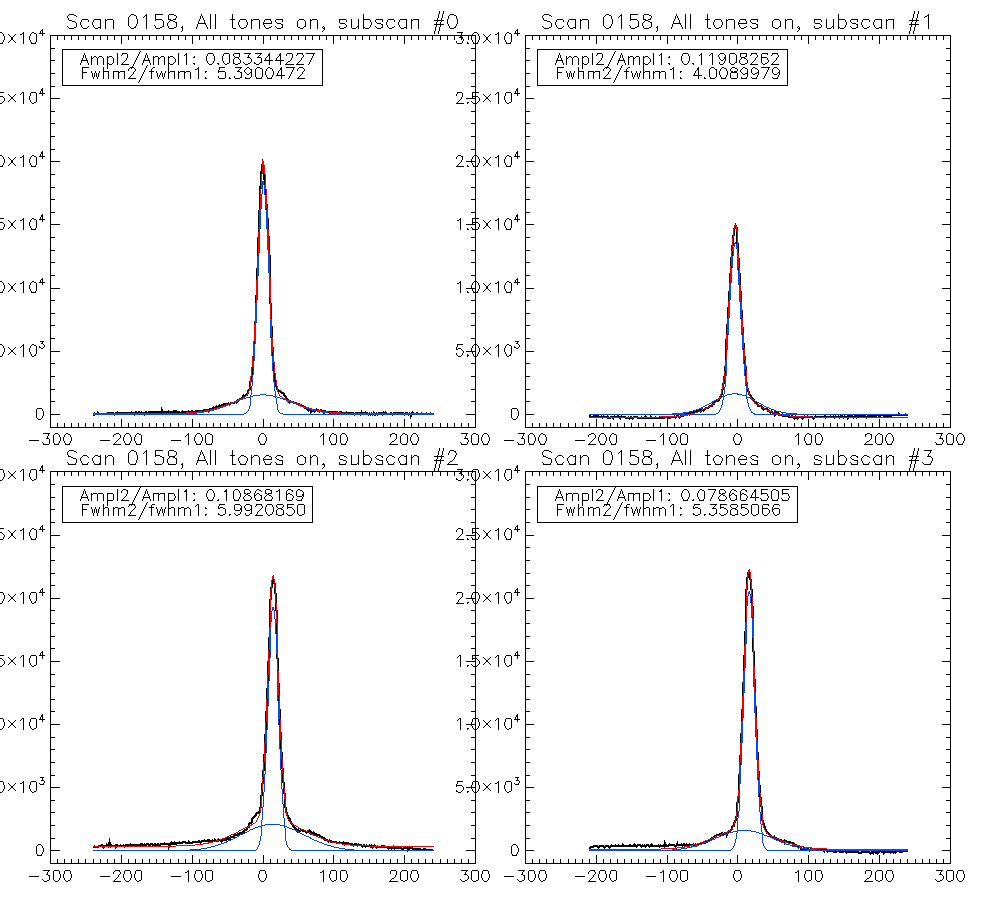
Example of fit of the main beam + a the plateau modeled as a second gaussian (for convenience)

Ratios of (plateau amplitude)/(peak amplitude) and (plateau FWHM)/(peak FWHM) for all scans. The scan with all tones off but the reference kid is highlighted in red and is not significantly different from the other ones.


