|
Size: 664
Comment:
|
← Revision 38 as of 2020-06-15 12:16:37 ⇥
Size: 1254
Comment:
|
| Deletions are marked like this. | Additions are marked like this. |
| Line 1: | Line 1: |
| [[Nika2Run3|Back to the NIKA2 run 3 main page]] | [[Continuum/NIKA2/Main|Back to the NIKA2 main page]] |
| Line 3: | Line 3: |
| NIKA2 bandpasses are described in Section 2.5 and Figure 1 of [[https://ui.adsabs.harvard.edu/abs/2020A%26A...637A..71P/abstract|Perotto et al. (2020)]]. They have been measured in the laboratory. The following fits file contains all 3 bandpasses: [[attachment:Transmission_2017_Jan_NIKA2_v1.fits]]: {{attachment:nika2_bands.png}} |
<<TableOfContents(5)>> |
| Line 7: | Line 5: |
| == Information for Observers on NIKA2 Bandpasses == === Bandpasses of the NIKA2 Arrays === |
|
| Line 8: | Line 8: |
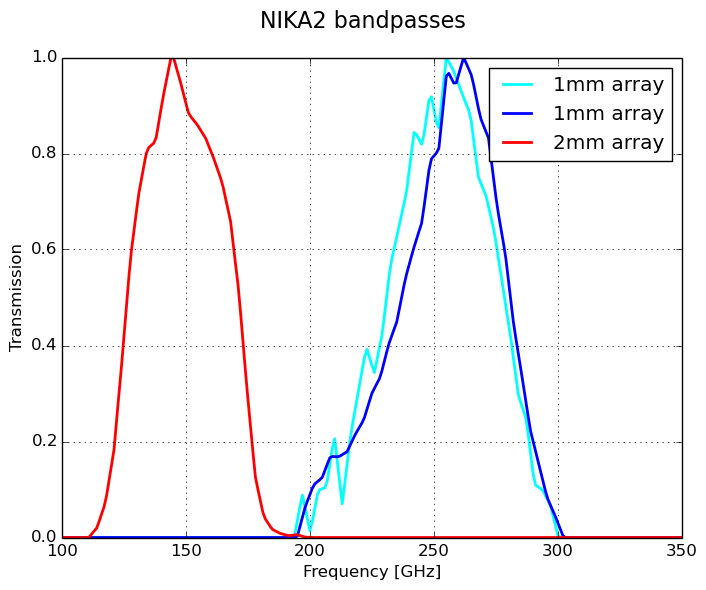
| --------- | For convenience, we provide one ASCII file with the three NIKA2 bandpasses and three atmospheric transmission curves for 2mm, 4mm, and 7mm of precipitable water vapour: [[attachment:nika2-bandpasses-atm.dat]]. The instrumental bandpasses have already been corrected for the Rayleigh-Jeans source emission. They are shown in the figure below and also in Figure 1 of [[https://ui.adsabs.harvard.edu/abs/2020A%26A...637A..71P/abstract|Perotto et al. (2020)]]. These bandpasses were measured in the laboratory in Grenoble. |
| Line 10: | Line 10: |
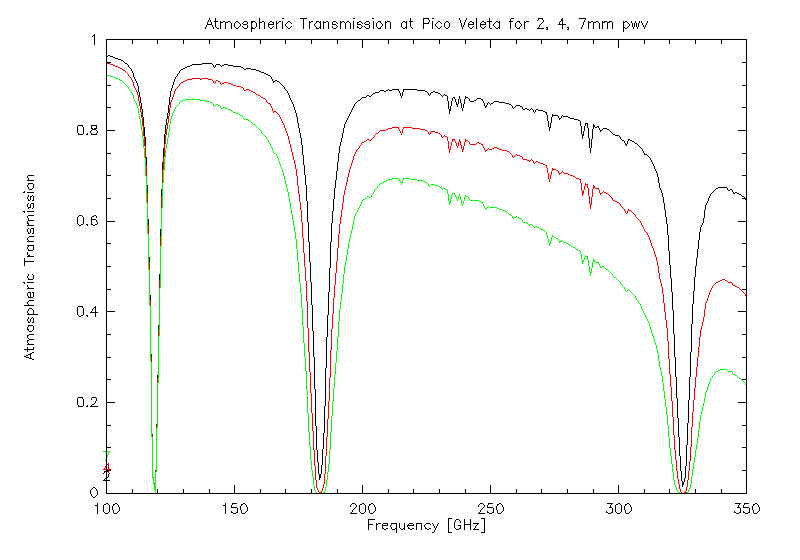
| OLD INFORMATION, POSSIBLY OUTDATED: | === Atmospheric transmission curves === The ATM model of J.Pardo & P.Cernicharo was used to calculate the atmospheric transmission at Pico Veleta. See also the figure below. === Figures === {{attachment:nika2-bandpasses3.png||height=550}} {{attachment:atmos-transmission9.png||height=550}} === Old information === |
Contents
Information for Observers on NIKA2 Bandpasses
Bandpasses of the NIKA2 Arrays
For convenience, we provide one ASCII file with the three NIKA2 bandpasses and three atmospheric transmission curves for 2mm, 4mm, and 7mm of precipitable water vapour: nika2-bandpasses-atm.dat. The instrumental bandpasses have already been corrected for the Rayleigh-Jeans source emission. They are shown in the figure below and also in Figure 1 of Perotto et al. (2020). These bandpasses were measured in the laboratory in Grenoble.
Atmospheric transmission curves
The ATM model of J.Pardo & P.Cernicharo was used to calculate the atmospheric transmission at Pico Veleta. See also the figure below.
Figures


Old information
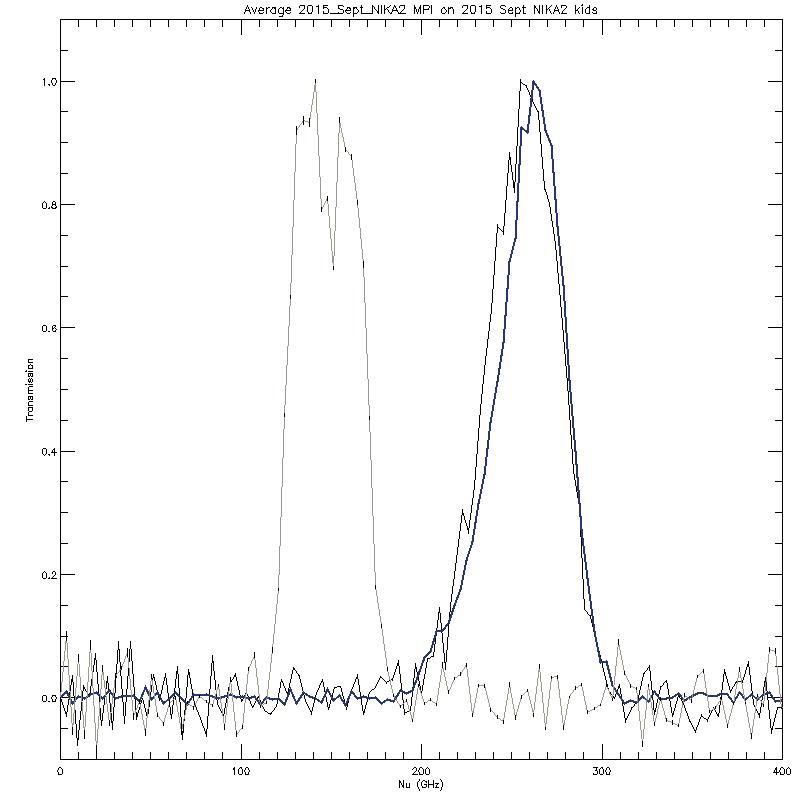
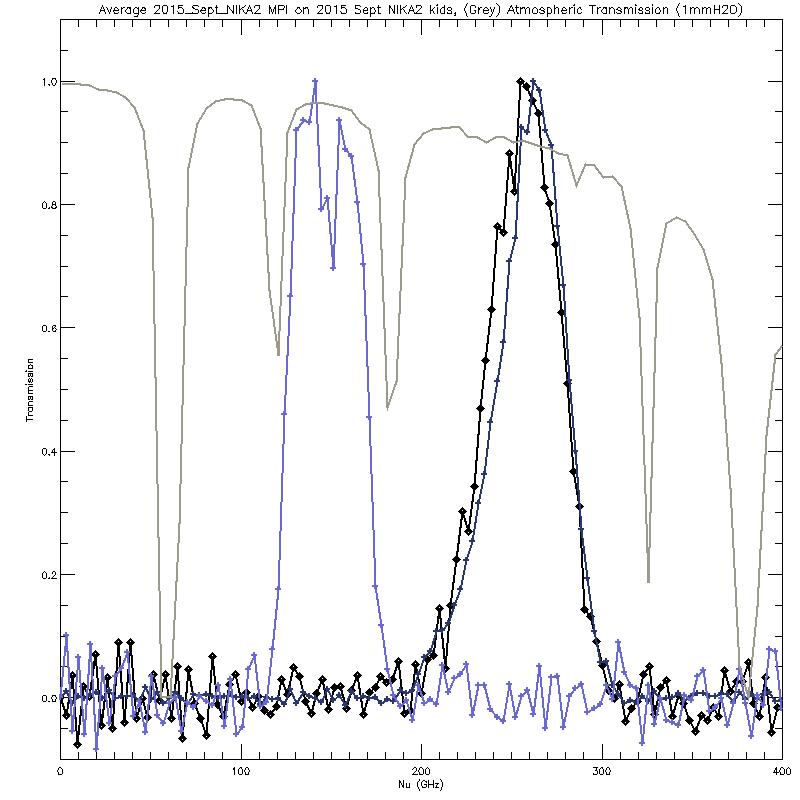
The spectral bands as measured in Néel (note that the two 1.15mm arrays are pretty similar but there is a detectable difference):


