|
Size: 42
Comment:
|
Size: 1363
Comment:
|
| Deletions are marked like this. | Additions are marked like this. |
| Line 1: | Line 1: |
| The spectral bands as measured in Néel: | [[Continuum/NIKA2/Main|Back to the NIKA2 main page]] <<TableOfContents(5)>> == Information for Observers on NIKA2 Bandpasses == === Bandpasses of the NIKA2 Arrays === For convenience, we provide here the three bandpasses: [[attachment:nika2-2mm-band.dat]], [[attachment:nika2-1mm-band-1.dat]], [[attachment:nika2-1mm-band-2.dat]]. These bandpasses have already been corrected for the Rayleigh-Jeans source emission. They are shown in the figure below and also in Figure 1 of [[https://ui.adsabs.harvard.edu/abs/2020A%26A...637A..71P/abstract|Perotto et al. (2020)]]. These bandpasses were measured in the laboratory in Grenoble. === Atmospheric transmission curves === The ATM model of J.Pardo & P.Cernicharo was used to calculate the atmospheric transmission at Pico Veleta for three different amounts of precipitable water vapour: 2, 4, 7mm: [[attachment:atmos2mm.dat]], [[attachment:atmos4mm.dat]], [[attachment:atmos7mm.dat]]. See also the figure below. === Figures === {{attachment:nika2-bandpasses3.png||height=550}} {{attachment:atmos-transmission9.png||height=550}} === Previous bandpasses of 2015 === The spectral bands as measured in Néel (note that the two 1.15mm arrays are pretty similar but there is a detectable difference): {{attachment:xavier_v1.jpg||height=615}} {{attachment:xavier_v2.jpg||height=615}} |
Contents
Information for Observers on NIKA2 Bandpasses
Bandpasses of the NIKA2 Arrays
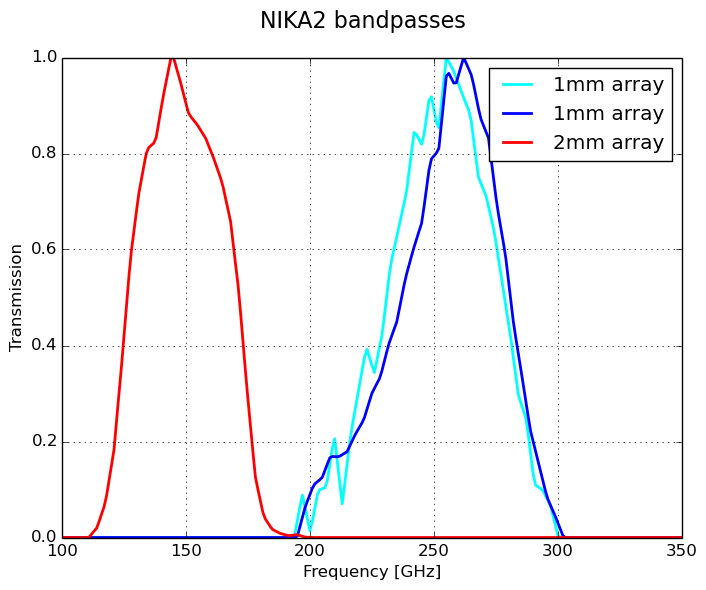
For convenience, we provide here the three bandpasses: nika2-2mm-band.dat, nika2-1mm-band-1.dat, nika2-1mm-band-2.dat. These bandpasses have already been corrected for the Rayleigh-Jeans source emission. They are shown in the figure below and also in Figure 1 of Perotto et al. (2020). These bandpasses were measured in the laboratory in Grenoble.
Atmospheric transmission curves
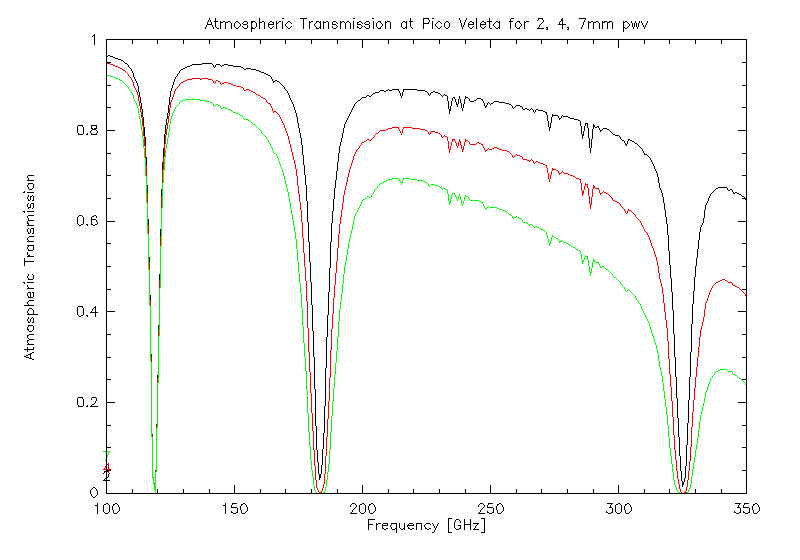
The ATM model of J.Pardo & P.Cernicharo was used to calculate the atmospheric transmission at Pico Veleta for three different amounts of precipitable water vapour: 2, 4, 7mm: atmos2mm.dat, atmos4mm.dat, atmos7mm.dat. See also the figure below.
Figures


Previous bandpasses of 2015
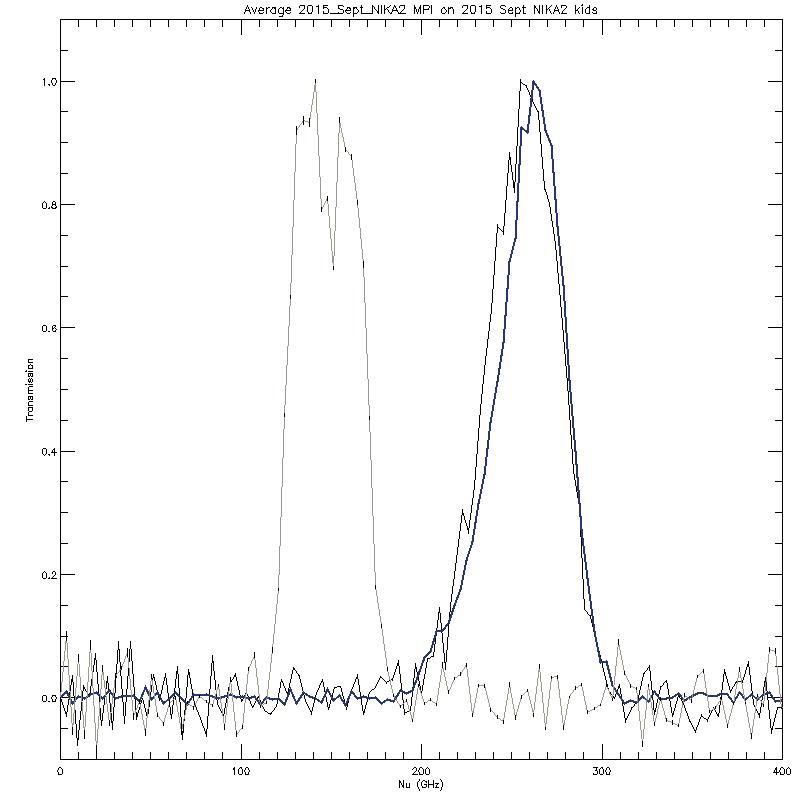
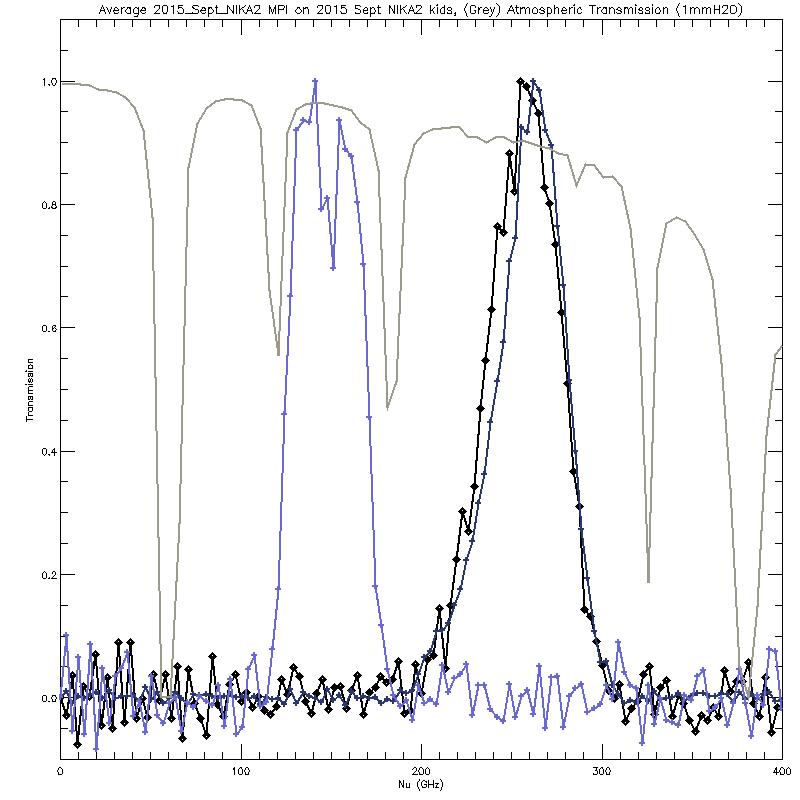
The spectral bands as measured in Néel (note that the two 1.15mm arrays are pretty similar but there is a detectable difference):


