|
Size: 1565
Comment:
|
Size: 751
Comment:
|
| Deletions are marked like this. | Additions are marked like this. |
| Line 7: | Line 7: |
| ---- /!\ '''Edit conflict - other version:''' ---- |
|
| Line 14: | Line 12: |
| ---- /!\ '''Edit conflict - your version:''' ---- | |
| Line 17: | Line 14: |
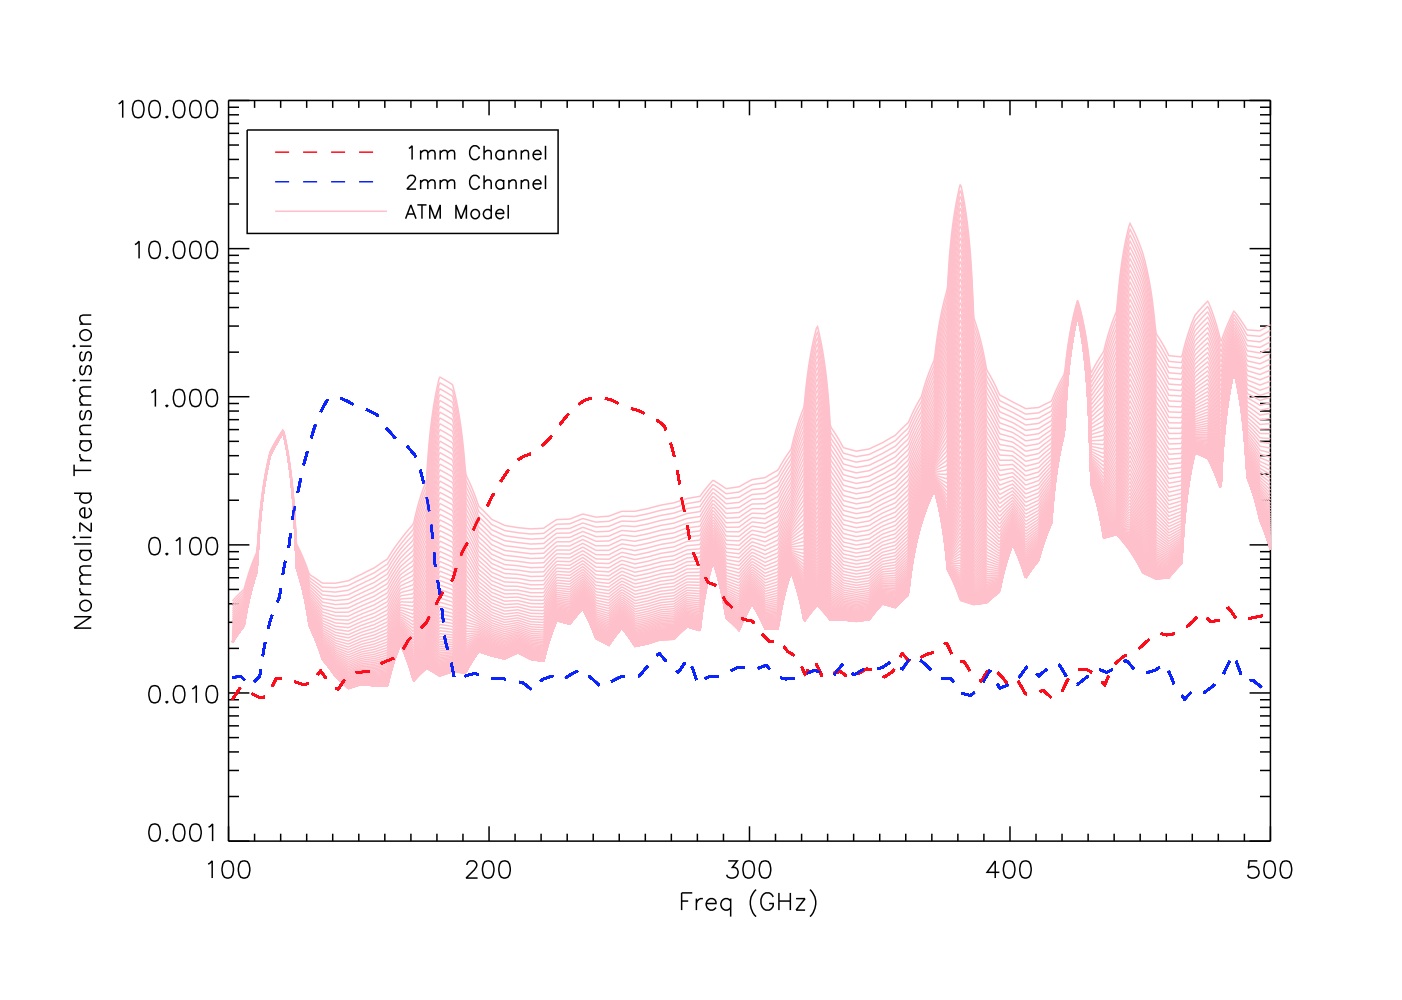
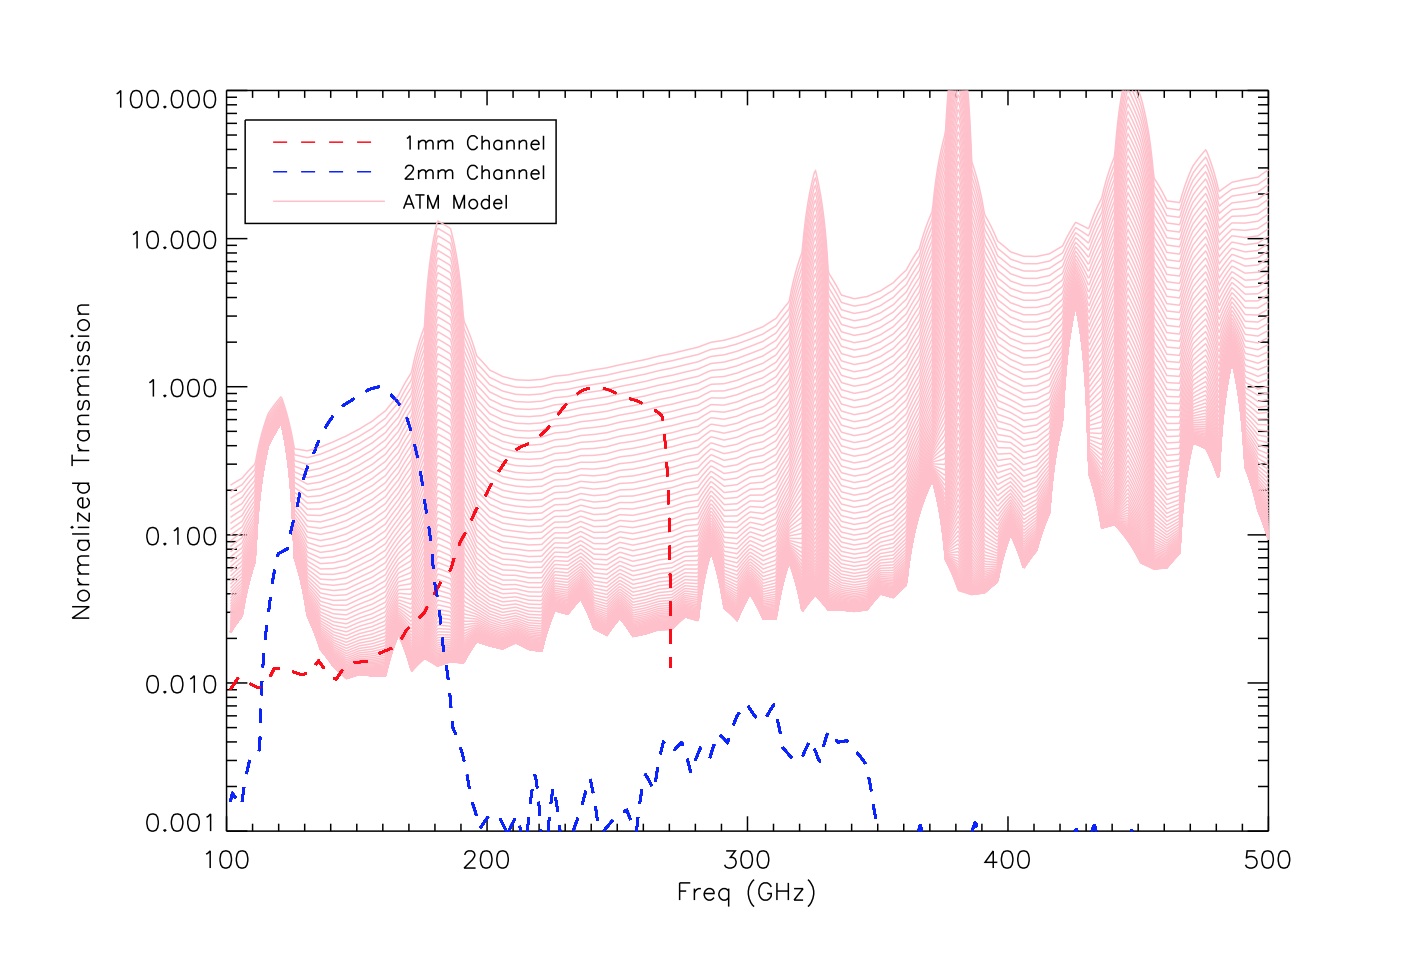
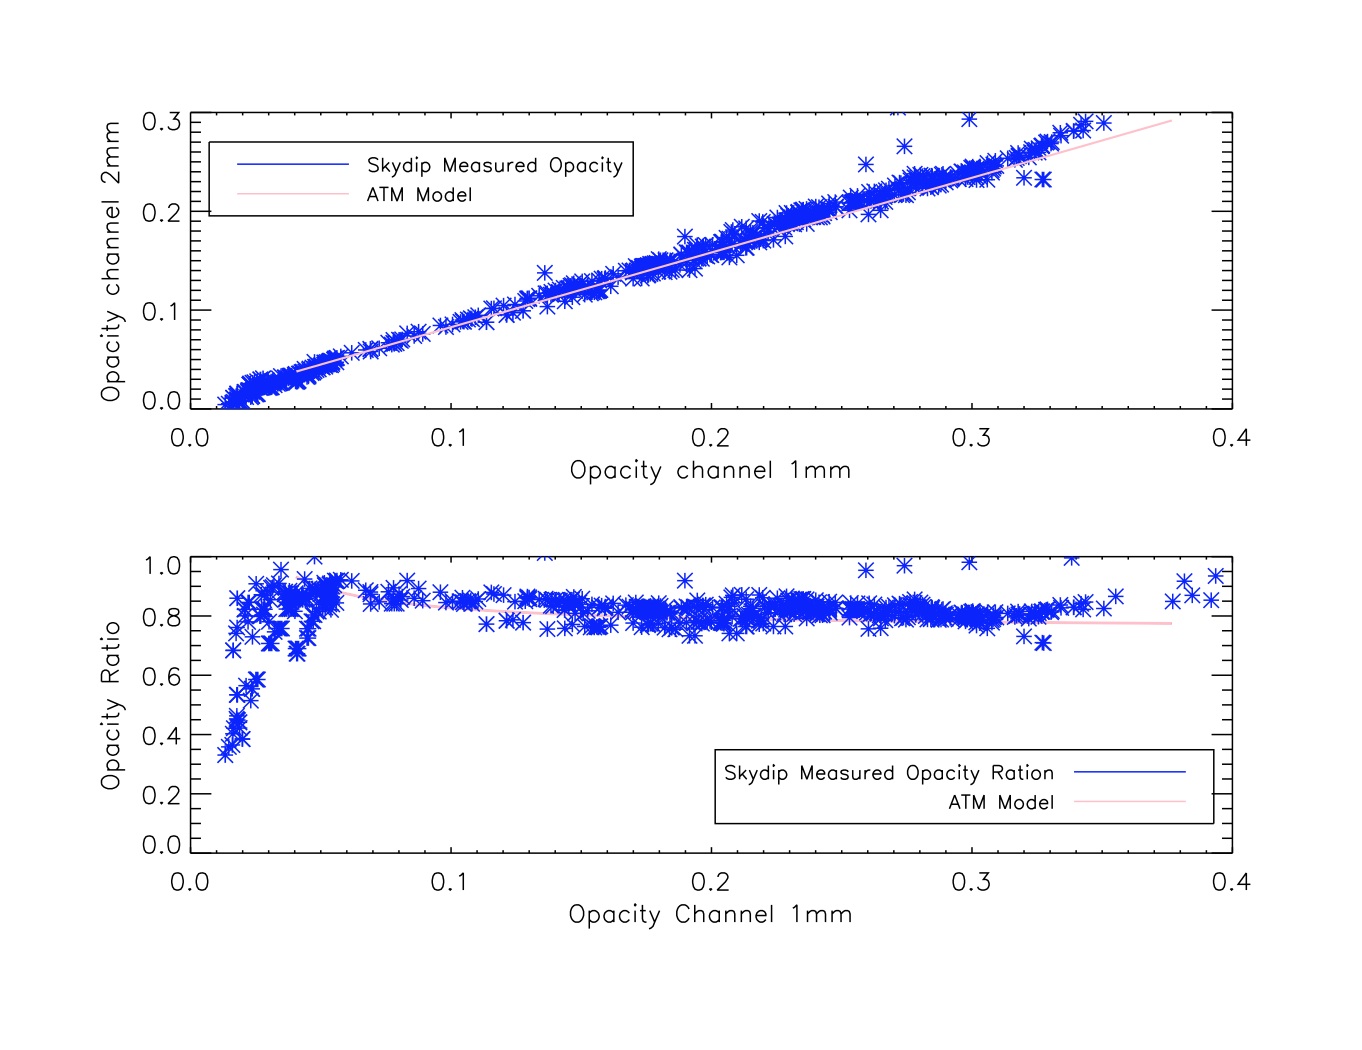
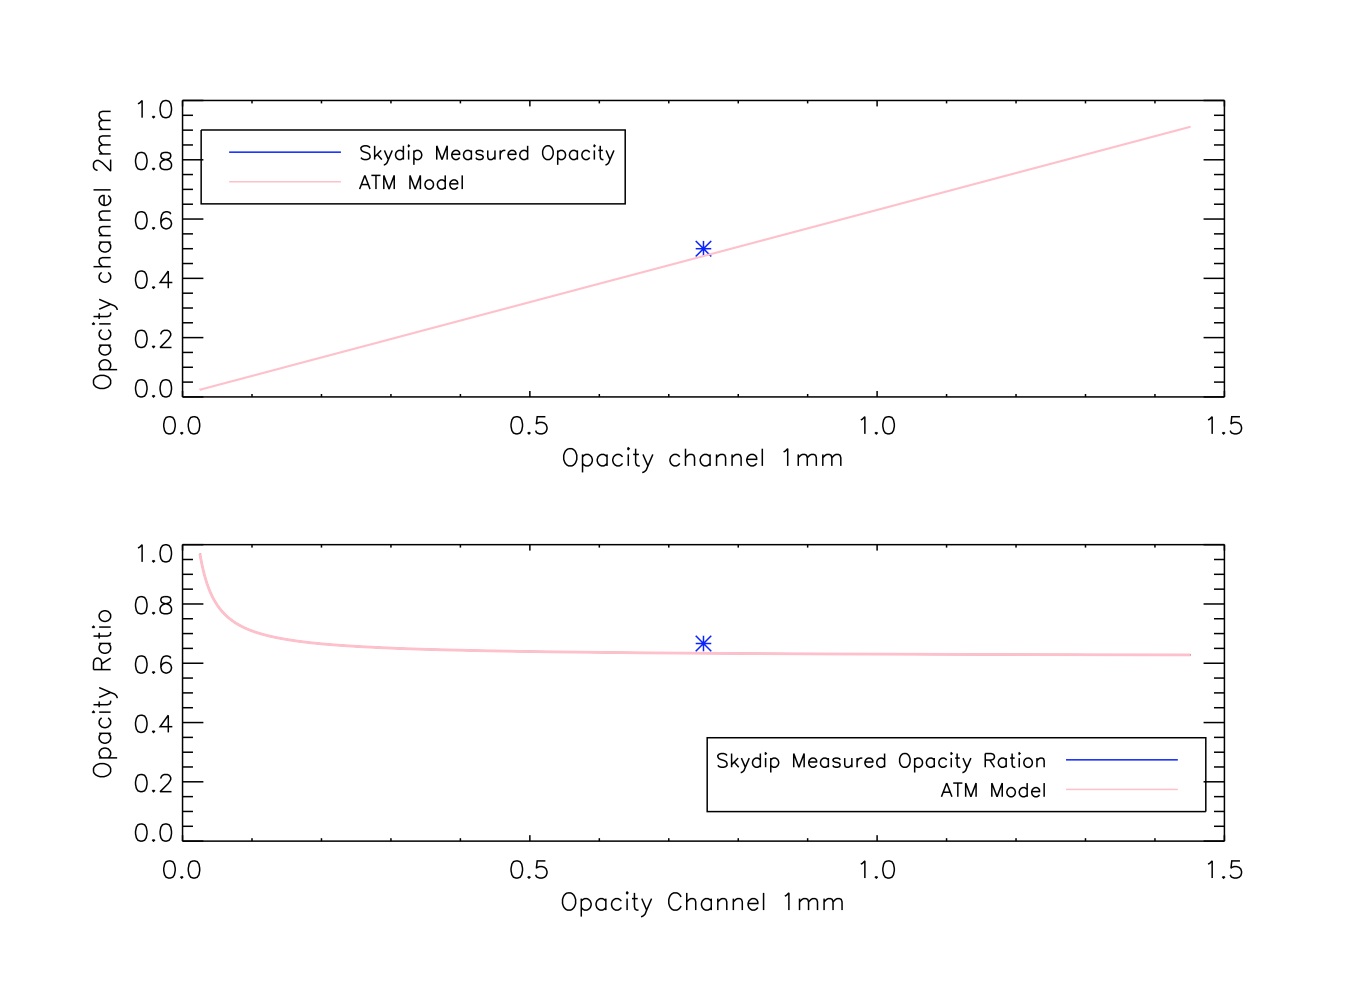
| == Description == We present a comparaison between the results obtained for run5 and run6. ---- /!\ '''End of edit conflict''' ---- ---- /!\ '''Edit conflict - other version:''' ---- {{attachment:atm_run5.jpg||width=400}} {{attachment:atm_run6.jpg||width=400}} ''Figure-1: NIKA band-pass for 1mm and 2mm channels for run5 (left) and for run6 (right)'' {{attachment:skyd_run5.jpg||width=400}} {{attachment:skyd_run6.jpg||width=400}} ''Figure-2: Comparison between the opacities Measured with the skydip technique the ones derived with the ATM model. left plot run5 right plot run6.'' ---- /!\ '''Edit conflict - your version:''' ---- |
|
| Line 48: | Line 24: |
---- /!\ '''End of edit conflict''' ---- |
Skydips Method: Comparison Run5-Run6 results with ATM Model
Description
We present a comparaison between the results obtained for run5 and run6.


Figure-1: NIKA band-pass for 1mm and 2mm channels for run5 (left) and for run6 (right). The purple curves correspond to the ATM model calculated for different water vapor contents.


Figure-2: Comparison between the opacities Measured with the skydip (blue points) technique the ones derived with the ATM model (purple lines). left plot run5 right plot run6.
