Skydips Method: Comparison Run5-Run6 results with ATM Model
Description
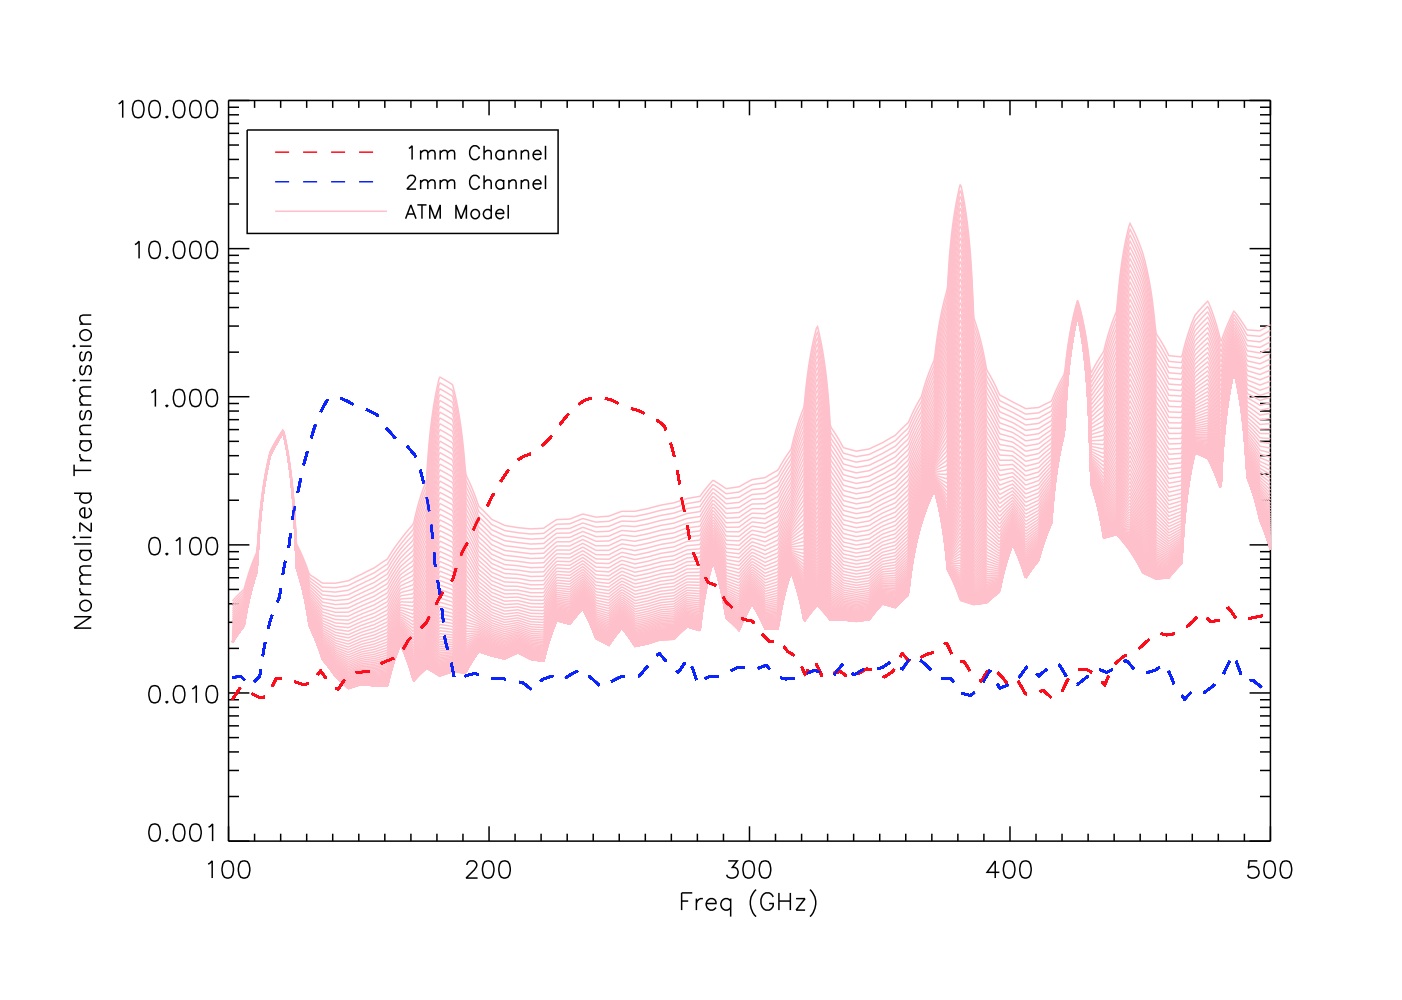
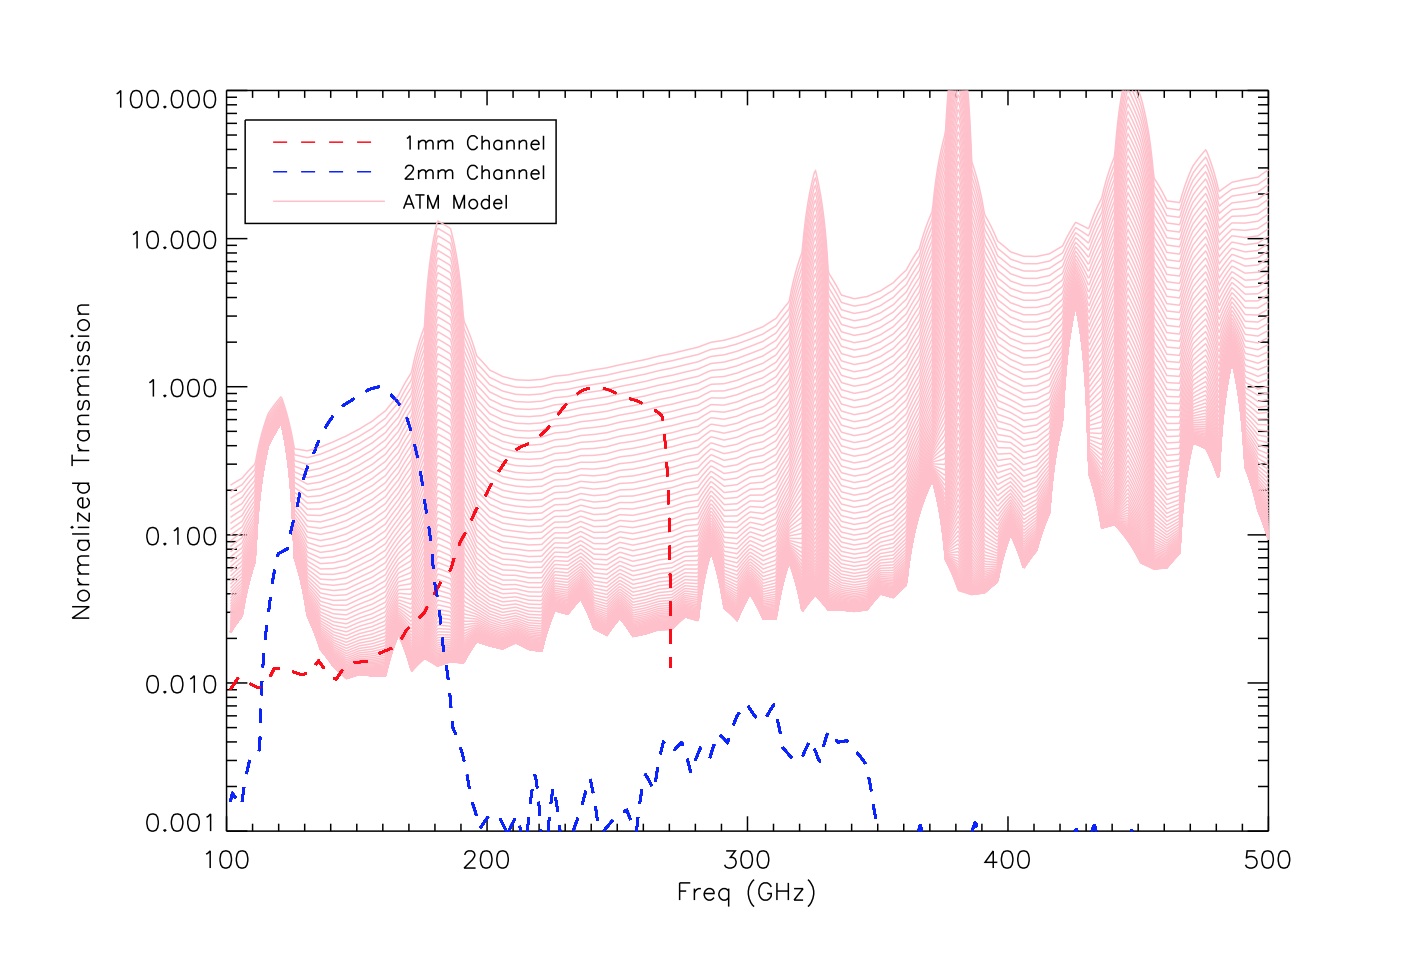
This is a comparison of the opacities derived with skydip technique between the run5 and run6. In Fig-1 we present the NIKA band-pass for the two NIKA channels together with the ATM model calculated for different water vapor contents. Note that the band-pass are different between run5 and run6, so we expect to have a different ratio between the opacities at 1mm and 2mm. The difference comes from a new design for the 2mm array (see the detector informations in the wiki) and an additional 9cm-1 filter in the 1mm optical chain.
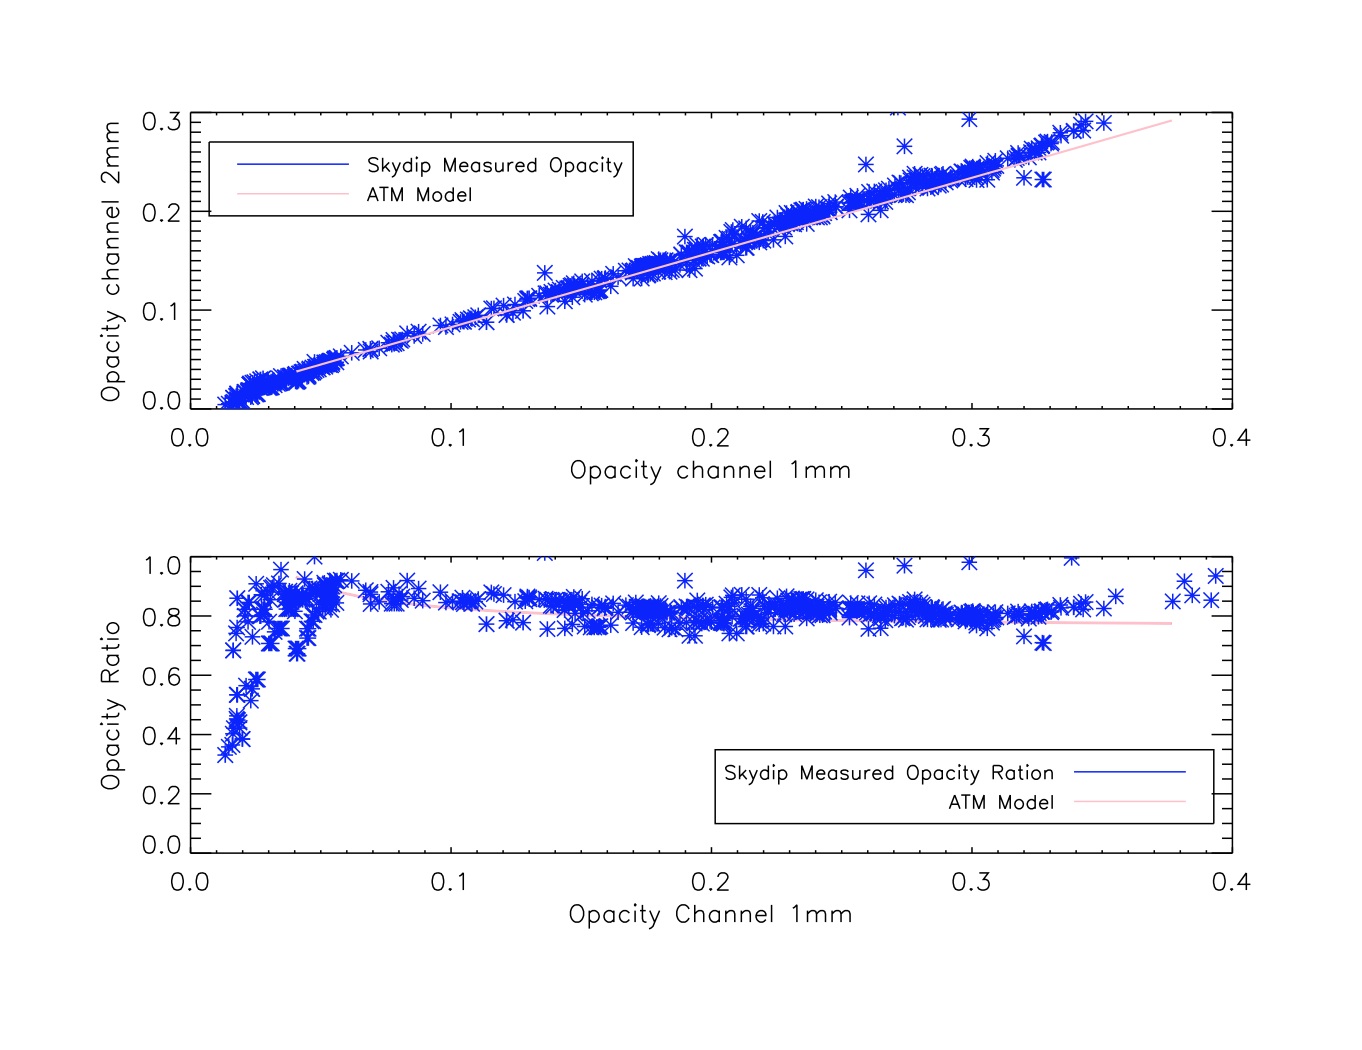
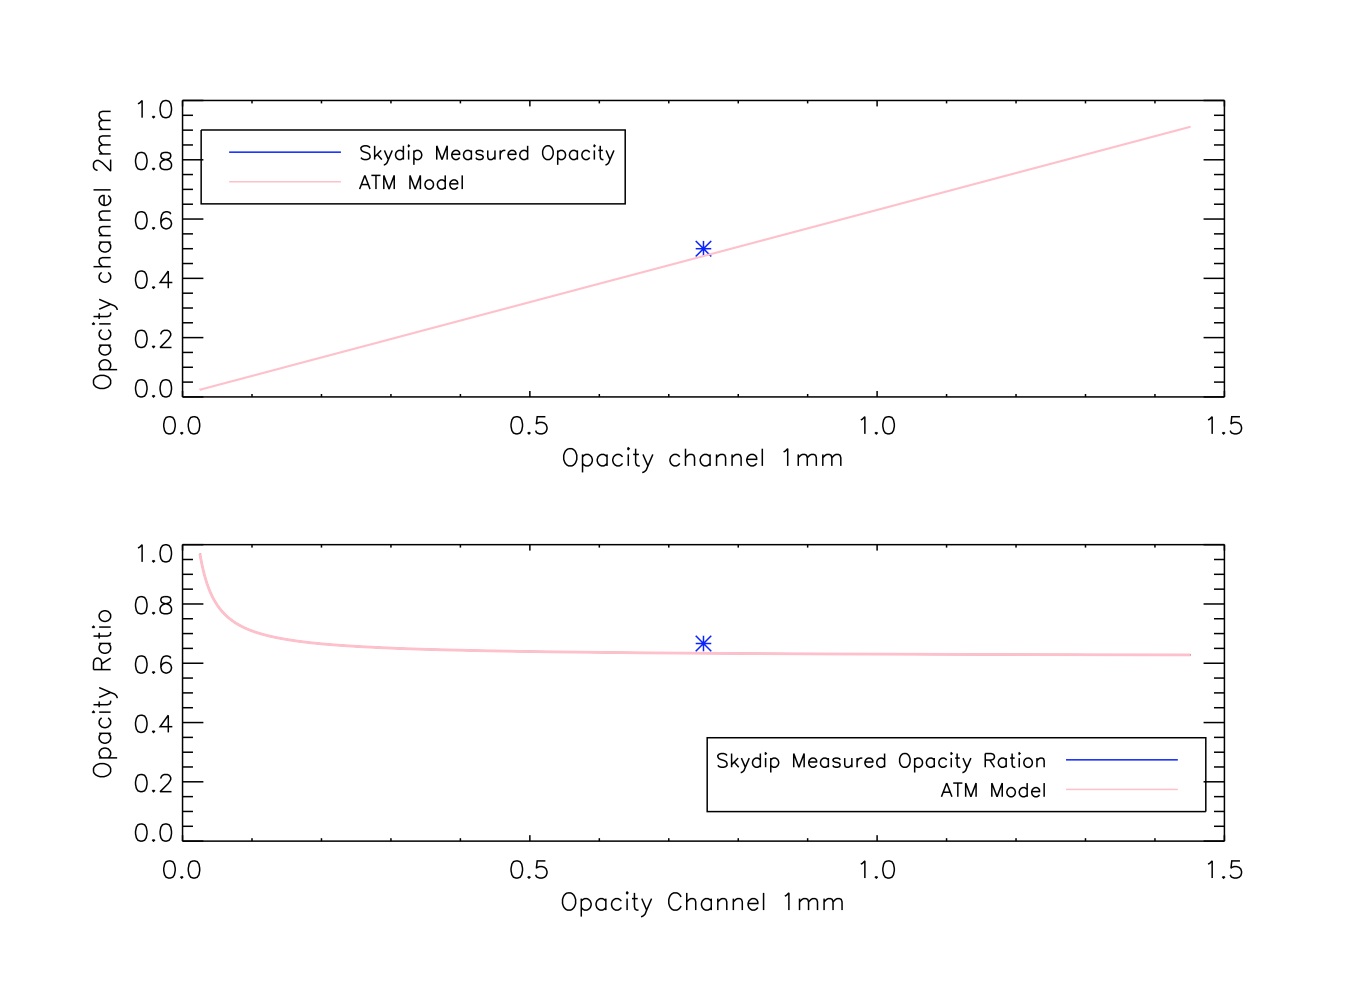
In fig-2 we present the comparison between the opacities derived for 1mm and 2mm (blue point) channels and the ATM model (purple line). The plots in the top present the results for the run 5 and the bottom plots for run6. Note that for the run6 we have juste one point corresponding to the opacities derived from the skydip performed on June 11th 2013 scan number 159.
The agreement between the measured opacities and the model is good for both run5 and run6.
|
|
Figure-1: NIKA band-pass for 1mm and 2mm channels for run5 (left) and for run6 (right). The purple curves correspond to the ATM model calculated for different water vapor contents.
|
|
Figure-2: Comparison between the opacities Measured with the skydip (blue points) technique the ones derived with the ATM model (purple lines). left plot run5 right plot run6.


