November 11th 2013, Alain Benoit, Martino Calvo and Andrea Catalano come to the 30m to install, cool down and testing the NIKA prototype.
12-13 November 2013: cryostat and Read-Out positioning in the cabin, cooling down, HWP Modulator installation at the pupil (120mm from the entrance lens of the cryostat).
14 November 2013: OTF geometries on Mars and Uranus. Check of the focal plane geometry. First light of NIKA prototype with polarisation facilities. In the afternoon tests on the power on the pixels check its uniformity on the 2 arrays.
15 November 2013: Cryostat back to 300K: 3He-4He mixture recovery, Turned off pulse tube, trap heating. Polarisation facilities dismantling. Back to Granada.
List of materials left at the telescope
List of materials shipped with the driver Philippe Fraisse
STATUS
Cryostat Temperature: 150mK (set by temperature control).
Arrays: 130 (129 good) pixels 2mm - about 1Hz/sqrtHz noise (sky with tau about 0); 201 (about 185 good) pixels 1mm - about 5Hz/sqrtHz noise (sky with tau about 0); The tests for the optimal power where conducted with the window closed with some alu foil -> not great in term of stability, could add some 1/f. Touching the foil made a clear signal (at least on the 1mm). The final values for the different DAC gains can be seen in this image:
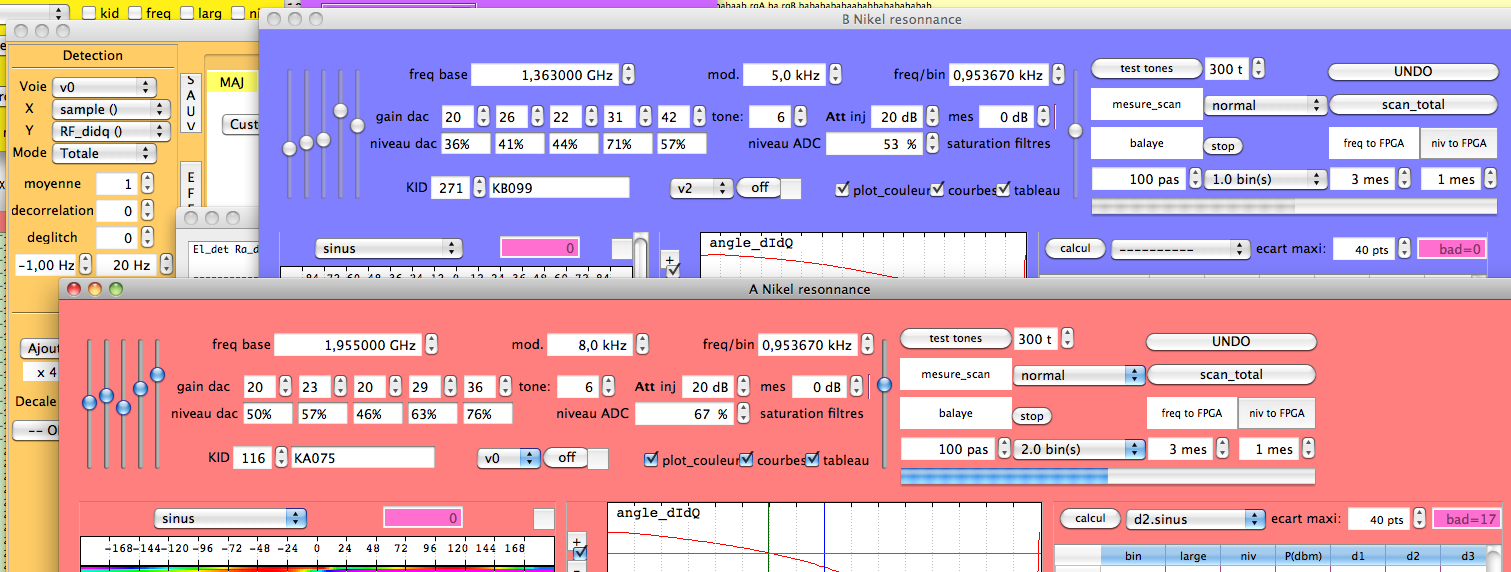
Figures: Settings of the 2 arrays. In red, NIKEL1 = 1mm, in blue NIKEL2 = 2mm.
Modulation frequency: 8kHz 1mm, 5kHz 2mm
Comments: The noise on the sky was difficult to compare to the one seen during the test; it seemed to be dominated by the 1/f of the sky, getting to the values cited above only at the end (10Hz) of the spectrum. During the afternoon, for the 2mm array we changed the DAC values to increase the power at the end of the band. The pixels fed by the last DAC (aka 'the bad ones'), at the end with the alu foil window looked like this:
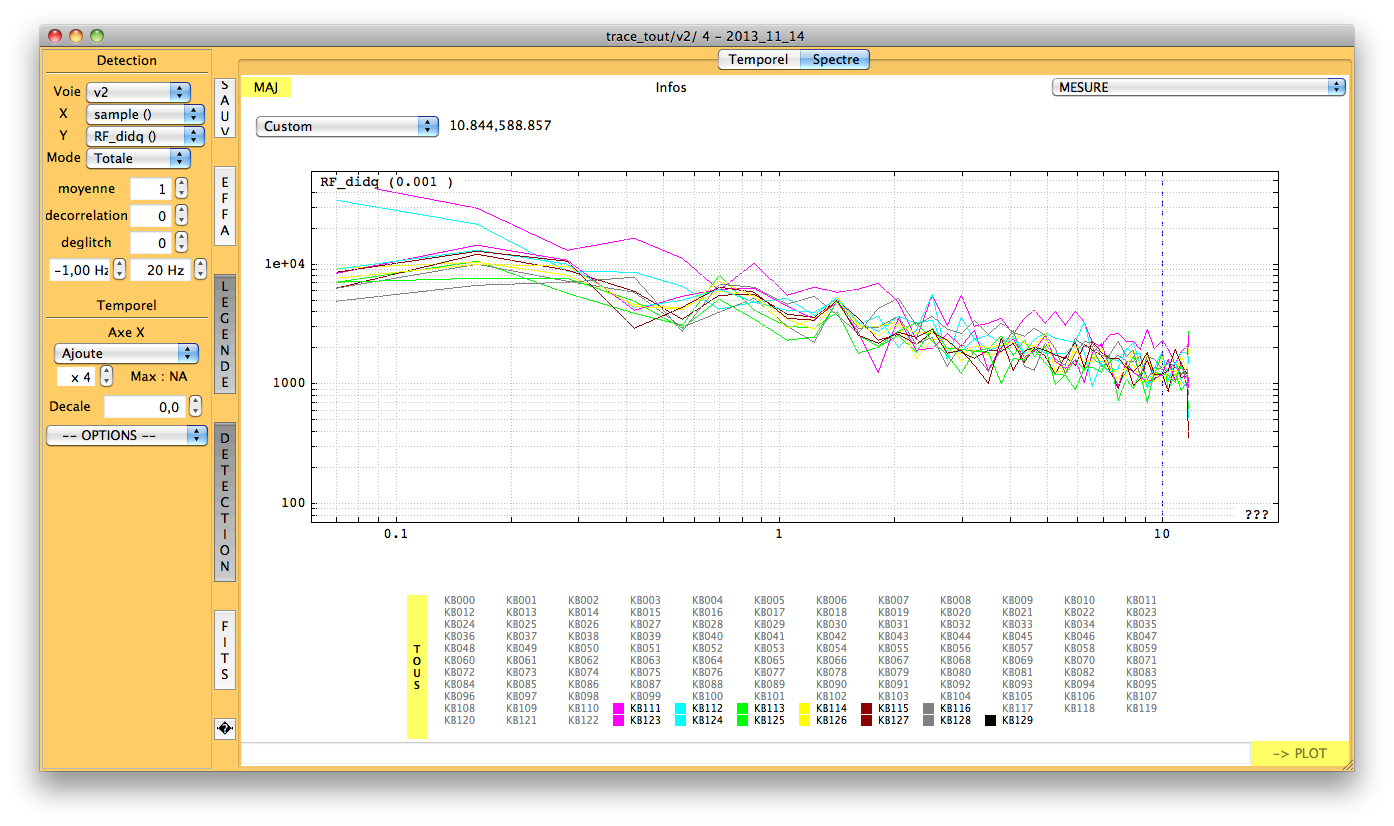
Figures: Noise on the last pixels of the 2mm array, looking at the alu foil.
The other pixels had in general flatter spectra.
On the 1mm, the noise is higher, being typically between 3 to 10 Hz/rtHz at 10Hz and increasing for lower frequencies.
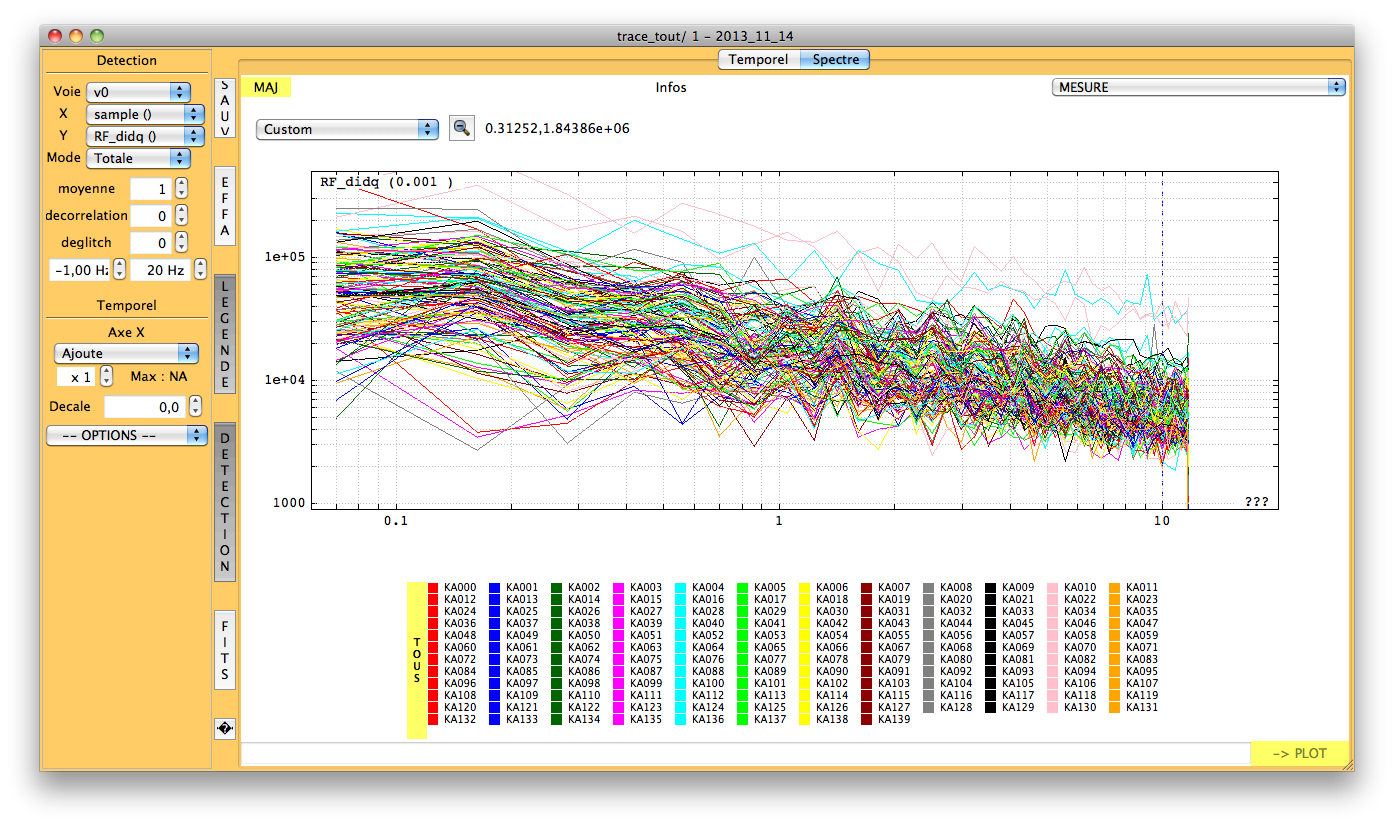
Figures: Noise on the all the pixels of the 1mm array, looking at the alu foil.
A few tests done to try to improve changed these values only a little bit. Maybe, though, the pixels are affected by the extra optical power on them. On sky, they could have been very probably better tuned, but the time was to scarce. Actually, when we went on sky, the settings chosen during the day ('tone' = 7) had to be changed 'on the fly' as with the lower optical load the readout power was too much. It was not possible to change it on a pixel by pixel basis so we just decided to lower 'tone' to 6 (roughly 1.5 dB less on each pixel). This allowed us to recover 'sane' resonances shapes but we have no idea if it was really the optimal condition. As usual, at the start of the 'real' run we should take all the necessary time on the sky to tune the detectors to their best conditions, as the 'on sky' conditions are difficult to replicate in the cabin. Anyway, on the sky we saw a lot of 1/f but that was clearly the atmosphere, which could be seen affecting us up to the 10Hz frequency probably..
OBSERVATIONS Log
Opacity is measured with the taumeter at 225 GHz
p2cor : 0
p7cor : 0
initial Focus : -2.40 mm
Scan |
UT |
Source |
Command |
Az |
El |
Pointing X, Y, Focus |
Tau225 |
Comment |
15 |
04h39 |
Mars |
Track |
|
|
0 , 0 , -2.4 |
0.15 |
|
16 |
04h45 |
Mars |
OTF_Geometry |
|
|
0 , 0 , -2.4 |
0.15 |
First map for choosing the reference pixels |
17-21 |
04h58-05h04 |
Mars |
Focus_Liss |
|
|
0, 0, -2.4 |
0.15 |
|
22 |
05h05 |
Mars |
Focus |
|
|
0, 0, -2.4 |
0.15 |
|
23 |
05h47 |
Mars |
OTF_Geometry |
|
|
0, 0, -2.4 |
0.15 |
Tuning working during the map |
211-218 |
21h34-21h57 |
Uranus |
Track 300 300 |
55 |
190 |
0, 0, -2.4 |
0.00001 |
|
220-224 |
22h01-22h08 |
Uranus |
Focus_Liss |
|
|
0, 0, -2.4 |
0.00001 |
optimal focus probably over the range |
225 |
22h10 |
Uranus |
Cross |
|
|
0, 0, -2.4 |
0.00001 |
|
226-230 |
22h12-22h18 |
Uranus |
Focus_Liss |
|
|
0, 0, -1 |
0.00001 |
set pointing Az=-12.8 El=3.8 set focus = -1.5 |
231 |
22h24 |
Uranus |
OTF_Geometry |
|
|
-12.8, 3.8, -1.5 |
0.00001 |
|
232 |
22h49 |
Uranus |
OTF_Geometry |
|
|
-12.8, 3.8, -1.5 |
0.00001 |
HWP+Pol (Geometry probably lost) |
241-245 |
23h34-23h47 |
others observing |
various |
|
|
|
|
HWP+Pol+Cryostat in the cabin environment |
FIRST RESULTS
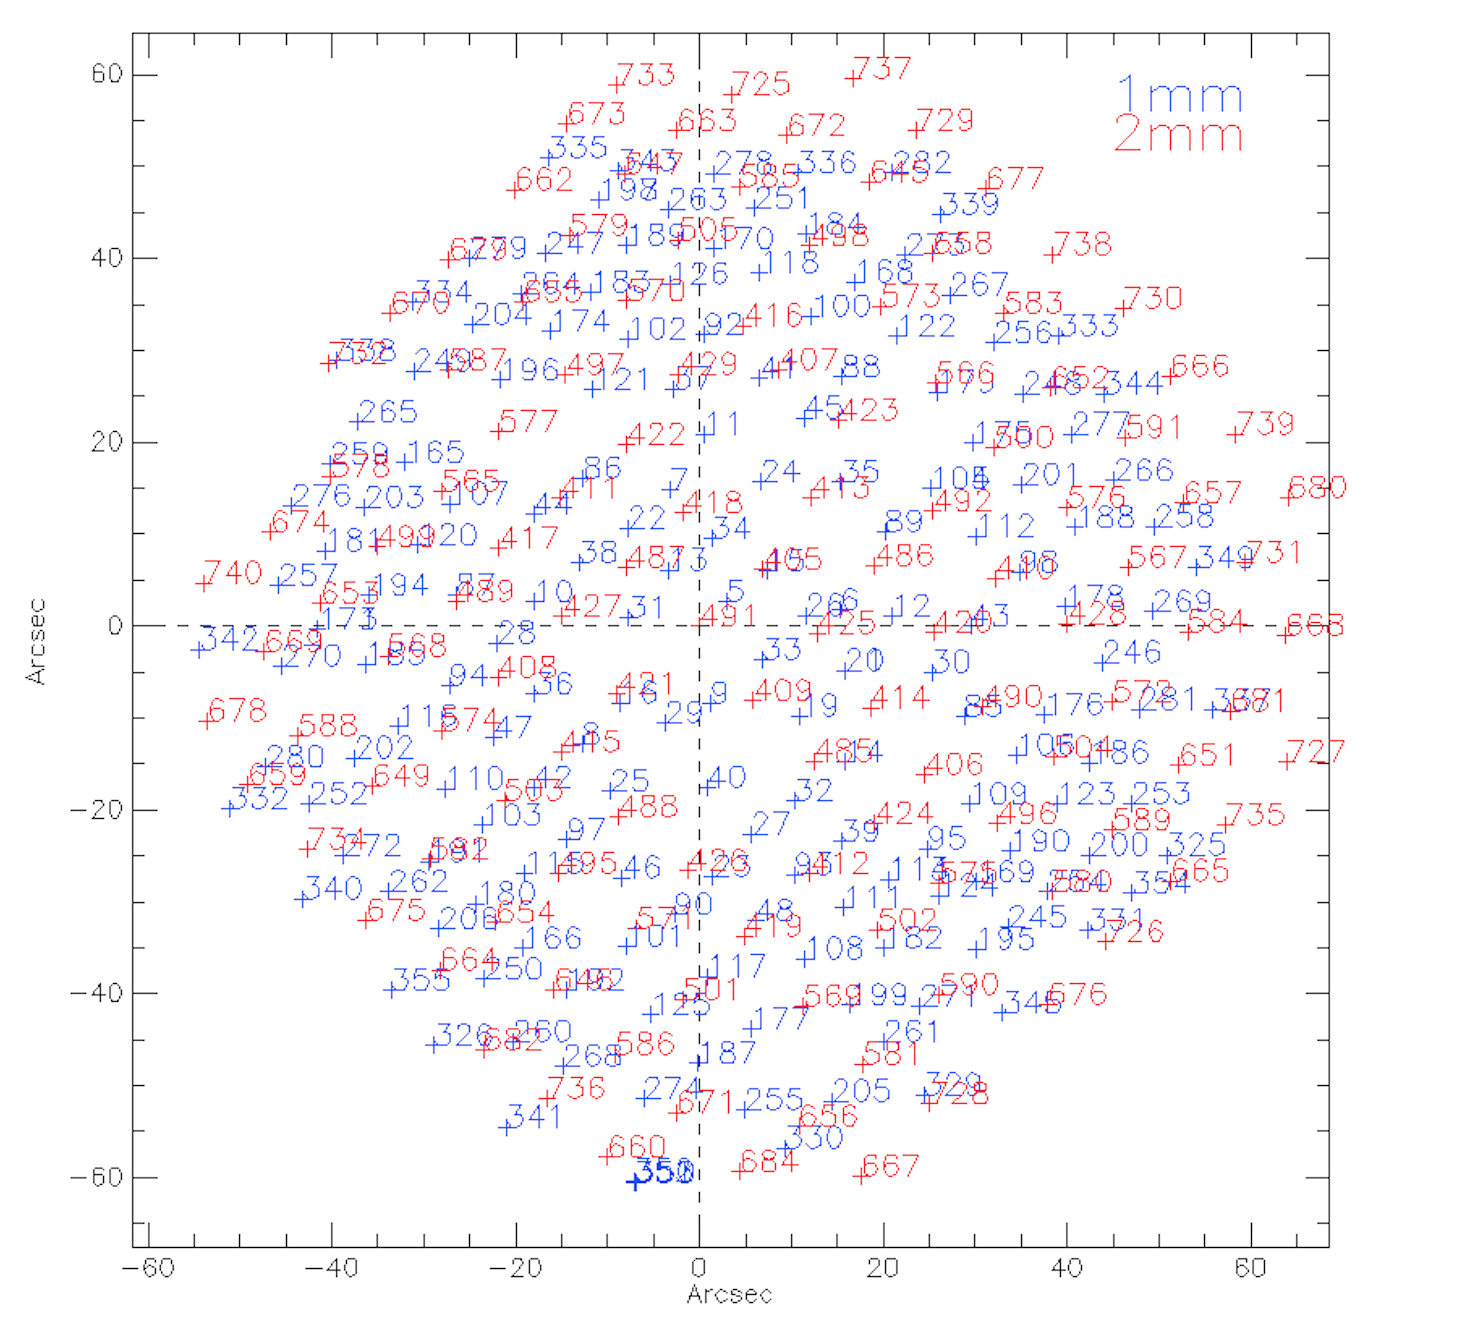
Figures: Focal Plane Geometry derived using scan 16: we chose the following reference pixels: 491 for 2mm array, 5 for 1mm array.
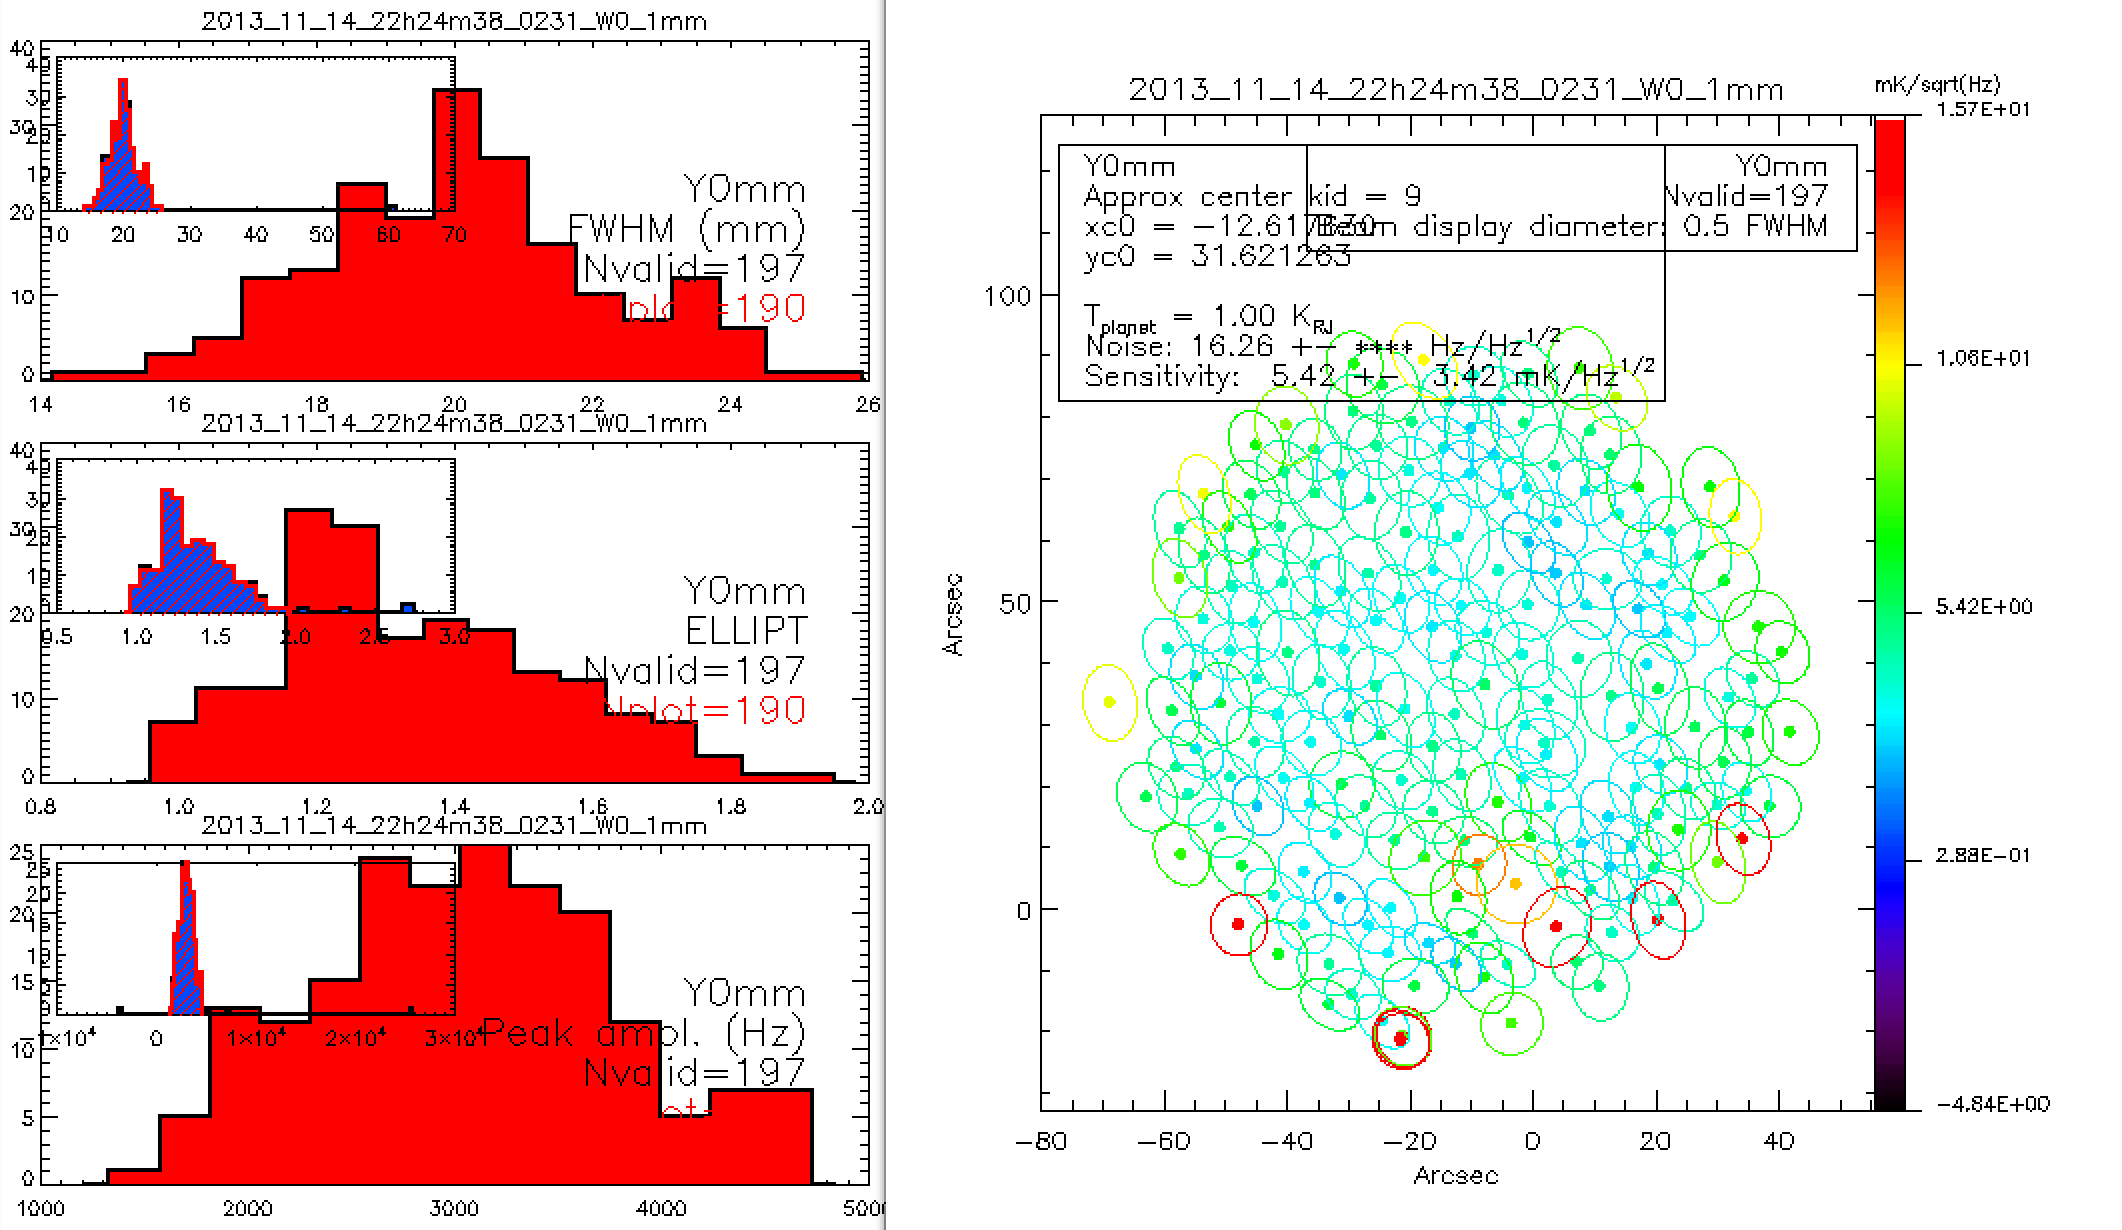
Figures: 1mm array from scan 231.
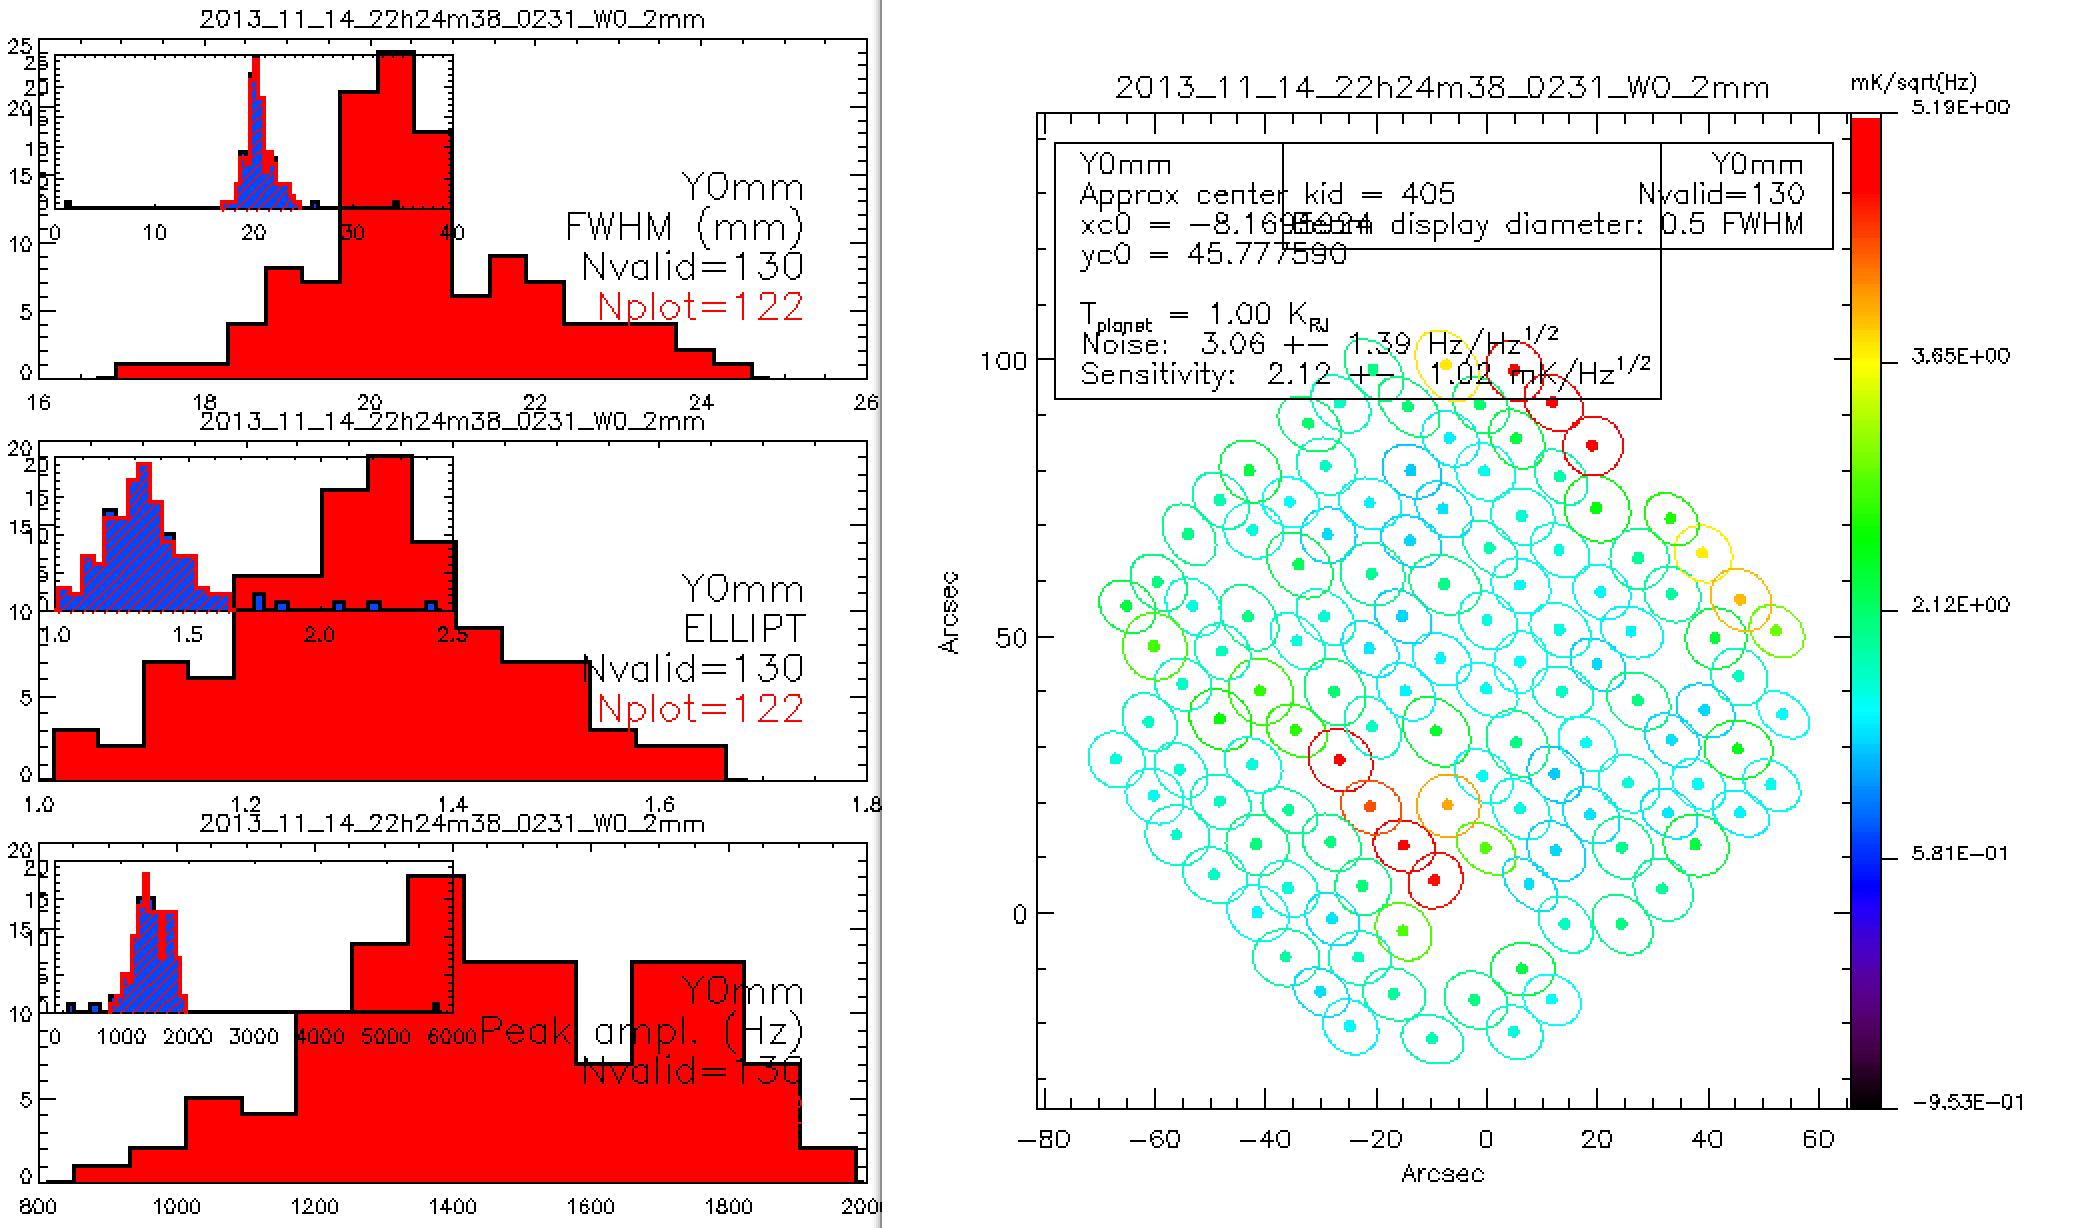
Figures: 2mm array from scan 231.
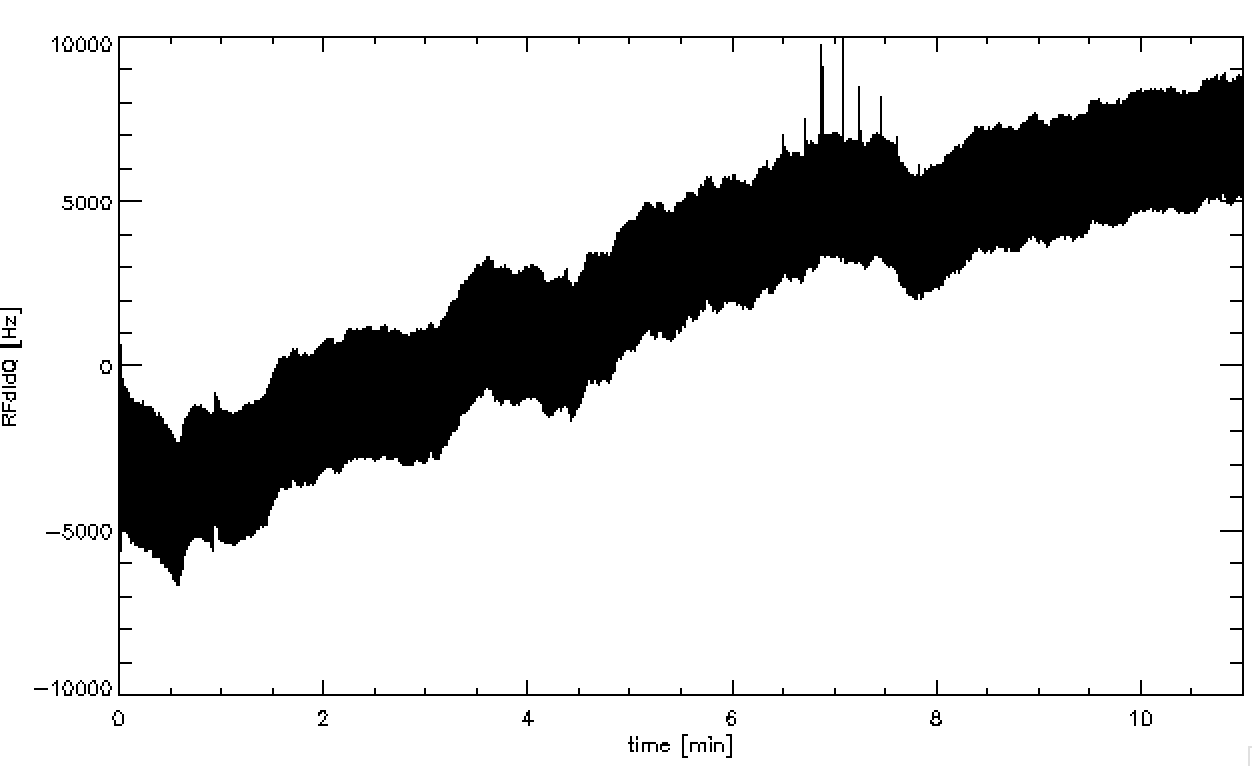
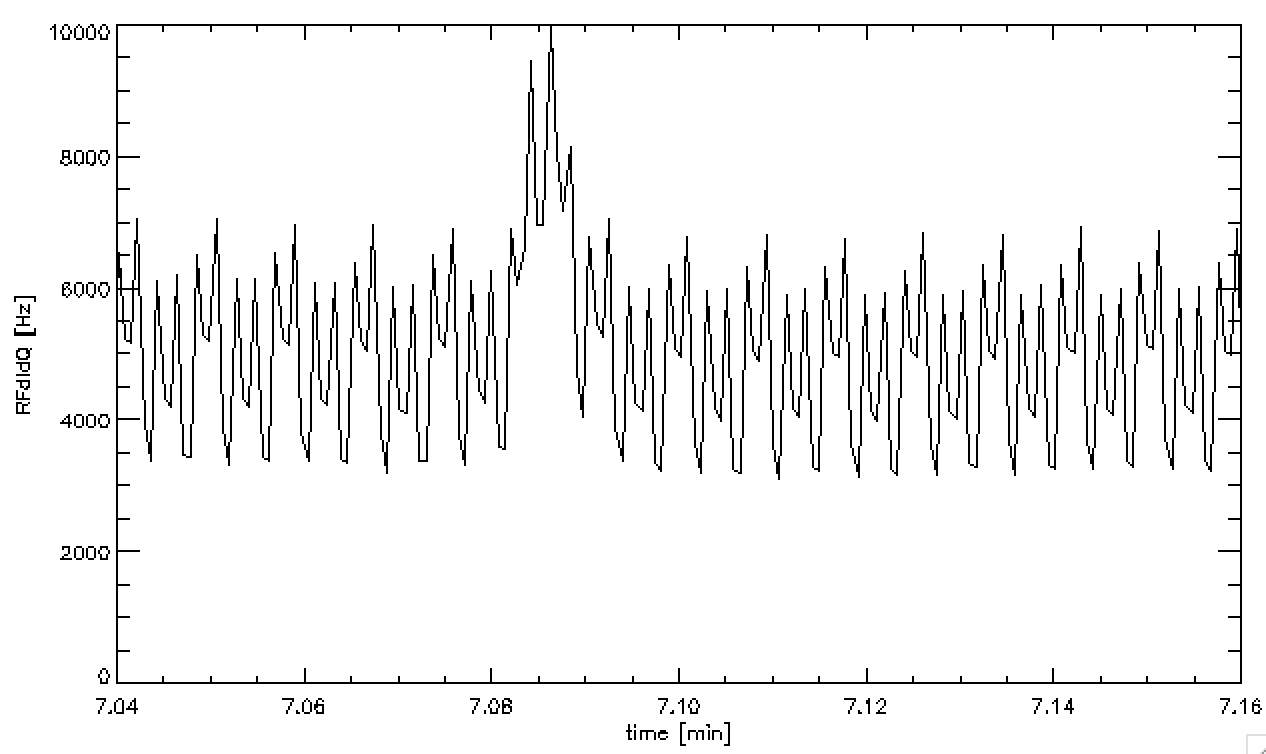
Figures: Entire (top) and zoomed (bottom) Timeline of the scan 232 on Uranus in configuration NIKA + HWP-Pol
First test of the polarization pipeline on this scan of Uranus !
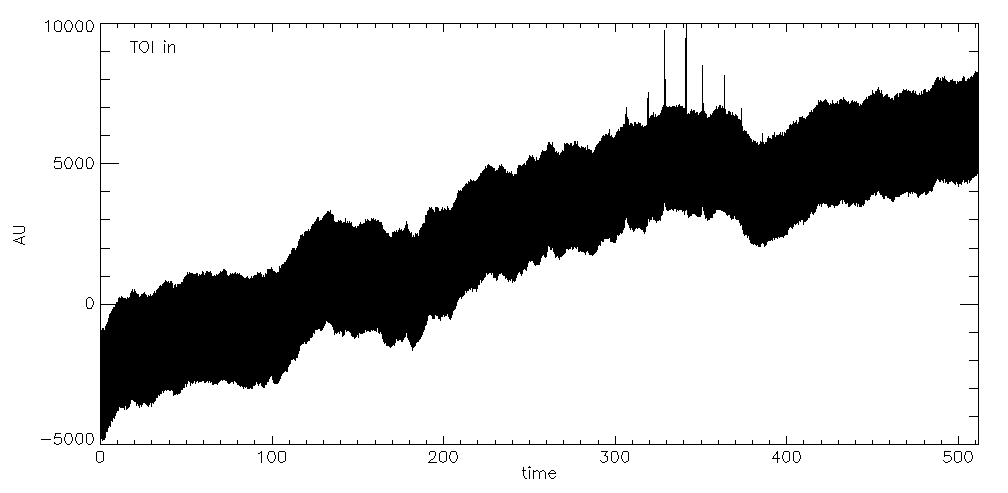
An Example of a rf_didq timeline. The planet hardly shows up behing a significant spurious signal at harmonics of the HWP rotation frequency.
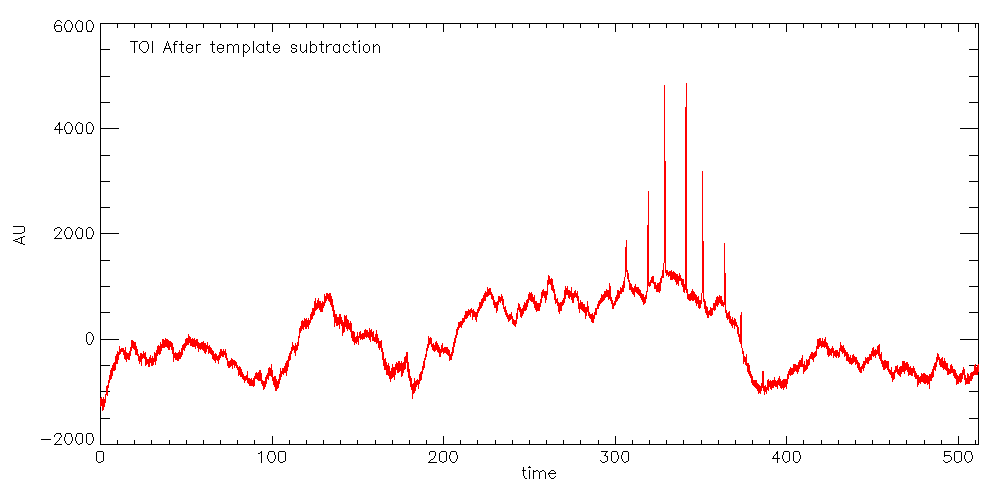
The spurious signal is fit as a sum of harmonics of the HWP rotation and subtracted. The obtained timeline now looks more like sky noise + signal
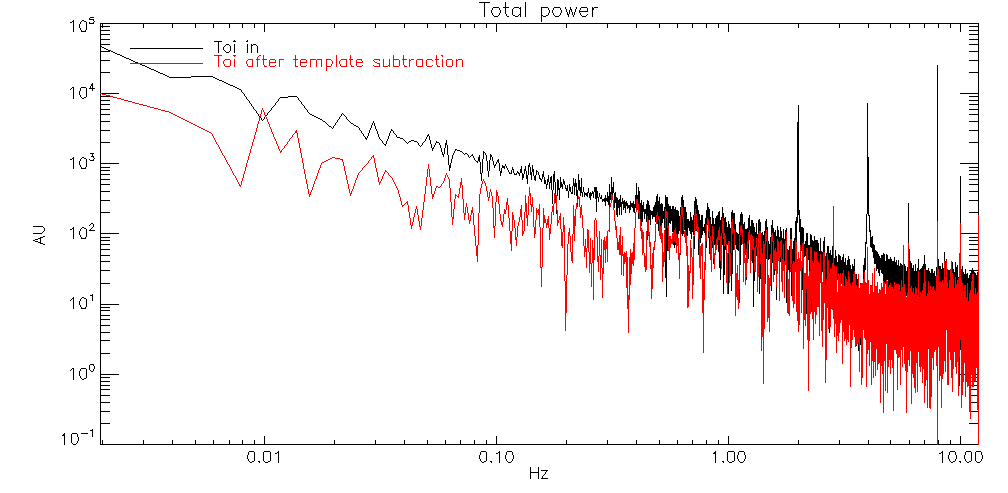
Here is the comparison at the power spectrum level.
and here are the maps (not absolutely calibrated yet):
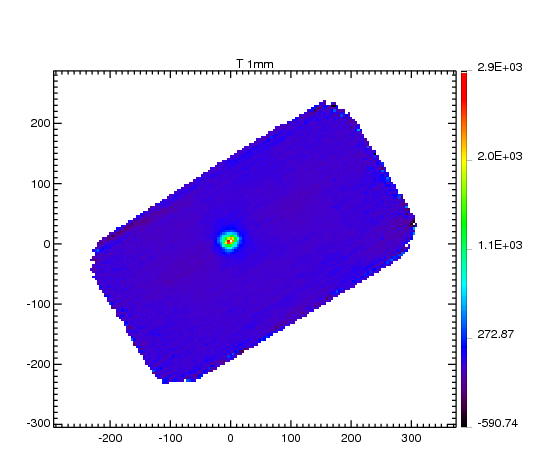
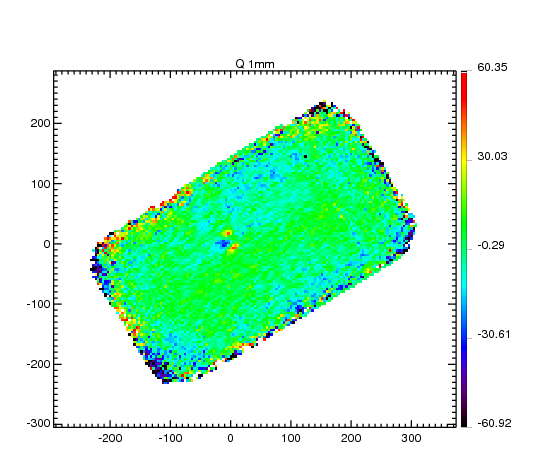
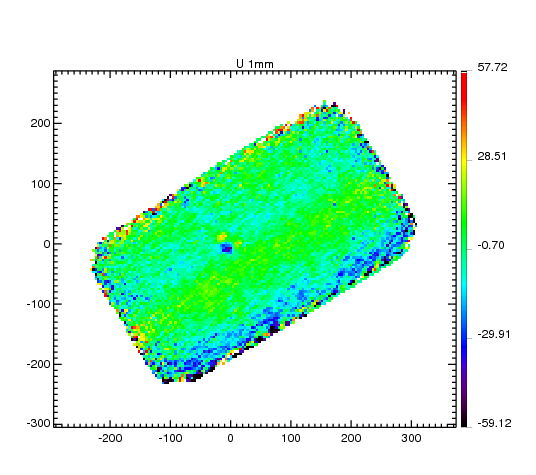
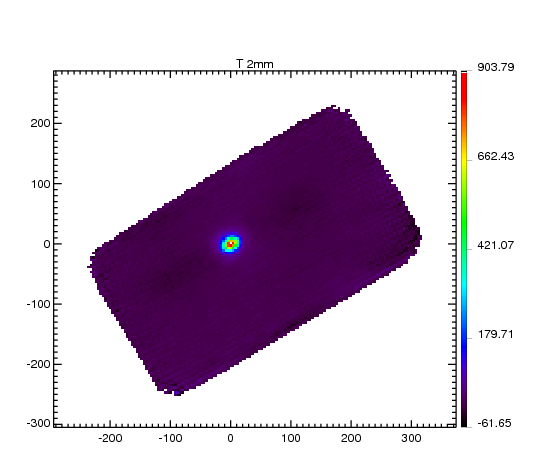
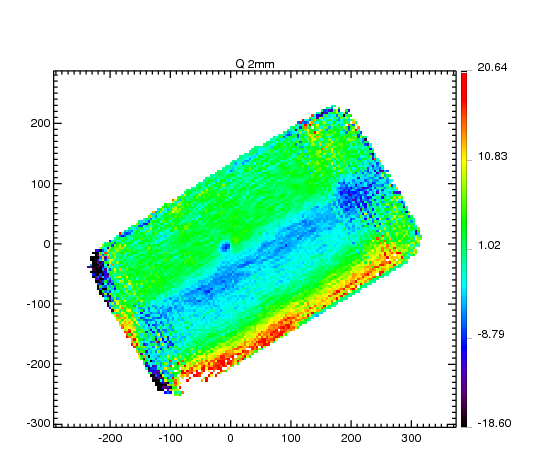
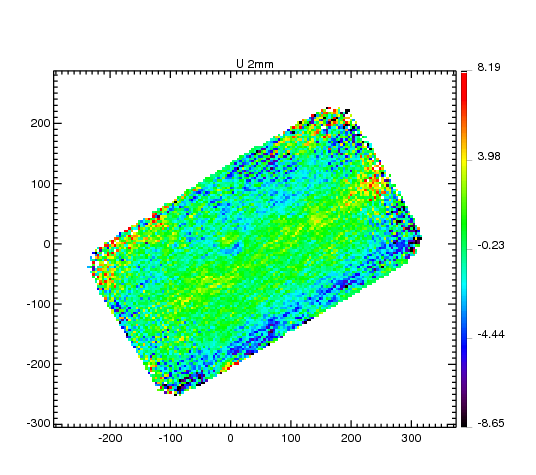
It certainly is too early to conclude, but the non zero signal seen in Q and U might be a hint of intrumental polarization at the level of 3 percent.
Further results on polarisation measurements will come soon.......
