|
Size: 8750
Comment:
|
Size: 15003
Comment:
|
| Deletions are marked like this. | Additions are marked like this. |
| Line 41: | Line 41: |
| ==== Origin of the large pointing errors ==== All the errors and effects shown above: scatter of the pixel positions, effect of the focus, imperfect pointing model a.s.o., cannot explain the very large (>10arcsec) pointing offsets. There must be still another problem I could not identify. ==== Update Feb 9: ==== To search for the source of the large pointing errors (and bimodal distribution in elev) I analysed also the pointings obtained with the heterodyne receivers. The poitings during the campaign are of mediocre quality but indicated some strange arcs in the plane (azCorrection,elCorrection). This finding is further confirmed by the (much clearer) examples below. Such a pointing behaviour of the telescope is new. [[attachment:plStrangePoi.png | pointing_corr_EMIR.png]] ==== RZ, 30 Nov 2011 - Beam maps ==== To determine the pixel positions, the effective beam shapes and the flat field I used 9 Mars maps observed from Oct 17 to 22. Maps observed later on are of too bad quality. I could use sources weaker than Mars (Uranus, Neptune, ...) with sky noise filtering to determine the pixel positions & beams, but without the line-of-sight tau-corrections could not calculate the flat field. The pixels which show a clear cross-talk within the main beam were excluded. ==== FoV geometry ==== {{attachment:rpo1mmMeanEdge_1_9_with3_29.png | scatter of pixel positions}} {{attachment:avRPo1mmMeanEdge_1_9.png | average FoV 1mm}} The figure above left (scatter of pixel positions) shows the derived pixel positions in each of the maps. Different markers and colors correspond to different maps. The scatter of the positions is larger in the centre and in the upper(left) part of NIKA, i.e this cannot be an atmospheric effect (anomalous refraction). For the few examples I checked, the changed positions were due to a cross-talk. The resulting average pixel positions are shown above right (fig. average FoV 1mm). ==== Centre of Nasmyth rotation ==== One very important point cannot be properly checked using the available data: the centre of the Nasmyth rotation. This centre is defined by the rotation axis of the mirror M3, but its determination depends also on the pointing behaviour. The ultimate proof would be if all the usable pixels would always show the source at one position, i.e. independent of the elevation and azimuth. For all coordinate transformations I had to assume this centre is close to pixel #21 (22 in my plots), as given by FXD. ==== Flat field ==== Update Dec 7: flat field for the beams in the near field. Two flat fields are necessary for the data processing: for the far field (i.e. main beam = astronomical sources, MBFF) and for the near field (sky noise, i.e. the correlated signal, CSFF). The correct main beam flat should use integrals over the main beams. However, because the reason(s) for the beam broadening (see below) are not clear to me, I used just the peak fluxes, i.e. a flat field (PFFF) valid only for on-offs observed with not filled receiver arrays like MAMBO, LABOCA or SCUBA. Currently I also did not use any extinction corrections. The peak flux flat field shown below is therefore just indicative. To calculate the flat for the beams in the near field in higher than first order approximation, just the slopes of the correlation distributions in data of weak sources are sufficient, i.e. when the assumption noise=data can be made (see "5 Dec 2011 - Instabilities, changed flat field, ..." below). Note that the calculation of the CSFF does not need any beam sizes. Whereas each of the flat fields depends on the pixel response to the incoming signal, the ratio of the flat fields does not. In the no-problem case the ratio of the flat fields shows simply the change of the coupling of the receiver to the telescope. It may vary, e.g. due to a distortion of the FoV, but this variation cannot explain the observed ratios of ~200%. {{attachment:ffMxAv.png | peakFlux flat field}} {{attachment:csffRef22_run3.png | corrSig flat field}} ==== Beam broadening ==== Strange beam broadening is visible both at 1 and 2mm. Two examples for Mars and Neptune are shown below. {{attachment:NIKA1mm-20111019s52_indFFmxRef22_1_rcp.png | beams 1mm Mars}} {{attachment:NIKA1mm-20111017s335_csf_indFFmxRef22_2_rcp.png | beams 1mm Neptune}} Pixel #1 is not reliable. Note also the larger and elliptical beams of pixels #29 and 40 for Neptune. This is an effect of the cross-talk. The beam broadening is visible also in I & Q (below) and at 2mm (not shown). {{attachment:NIKA1mm-20111019s52_indFFmxRef22_ph1_1_rcp.png | beam broadening in I}} {{attachment:NIKA1mm-20111019s52_indFFmxRef22_ph2_1_rcp.png | beam broadening in Q}} For comparison, below are shown the beam sizes @1mm during run 2. {{attachment:NIKA1mm-20101020s226_avFFgf_ref2mm_rcp.png | FoV and beams 1mm run2}} ==== Update Dec 9: ==== The beam broadening shows also a quite clear dependence on the pixel number. Below are shown the average FWHM of two first Mars maps @1mm. {{attachment:avGFnrPix_2firstMaps.png | FWHM(pixel number)}} We can therefore ask: is the beam broadening a function of the pixel number, the FoV distribution therefore just a result of the choice of the pixel position, or vice versa ? ==== Average beam sizes ==== For pointing sources weaker than roughly Neptune the errors of individual beams are too large to allow the check of the beam change across the FoV. Only the average beam shape can be fitted with sufficient accuracy. The figure below shows the major (triangles) and minor (circles) FWHM for all pointing sources available in the IMBFits format. There is a clear change of the observed beam size after the pointing run, as after the pointing run the sources appeared at different region of NIKA (recall: the pointing run was performed with the Nasmyth offsets for EMIR). This change is therefore an effect of the variation of the FWHM across the FoV. Within the errors there is no dependence of the FWHM on the source flux. {{attachment:fwhm1mmMJD.png | major and minor source sizes}} Example beam maps obtained on Mars (~160Jy), Uranus (~33.5Jy) and Neptune (~12.6Jy) with NIKA1mm are show below. The contour levels are at 0.4, 0.8, 1.6 ... 25.6 and 50%, for Mars also at 0.1 and 0.2% (in yellow). The averaged FWHM is in all cases ~15arcsec. {{attachment:NIKA1mm-20111019s52_aver.png | MarsbeamMap 1mm}} {{attachment:NIKA1mm-20111019s220_brCobl1_csfRan65_aver.png | Uranus beamMap 1mm}} {{attachment:NIKA1mm-20111017s335_br50bl1csfRan65_aver.png | Neptune beamMap 1mm}} ==== RZ, 1 Dec 2011 - The ''plateau'' ==== Update Dec 7: figures @2mm {{attachment:NIKA1mm-20111019s52_3_Jy.png | plateau@1mm uPixs Jy}} {{attachment:NIKA2mm-20111019s52_2_Jy.png | plateau@2mm uPixs Jy}} Details of the ''plateau''. The intensity scale is Jy/beam. The contour @1mm is at 9.5Jy/beam, @2mm 6.7y/beam. {{attachment:NIKA1mm-20111019s52_Jy_rows.png | plateau@1mm rows Jy}} {{attachment:NIKA1mm-20111019s52_Jy_cols.png | plateau@1mm columns Jy}} Intensity profiles @1mm per row (i.e. along the azimuth) and column (i.e. along the elevation) of pixels #22 (in red), #80 (in green), #102 (in cyan) and #105 (in blue). {{attachment:NIKA2mm-20111019s52_Jy_rows.png | plateau@2mm rows Jy}} {{attachment:NIKA2mm-20111019s52_Jy_cols.png | plateau@2mm columns Jy}} Intensity profiles @2mm per row (i.e. along the azimuth) and column (i.e. along the elevation) of pixels #11 (in red), #104 (in green), #105 (in cyan) and #91 (in blue). {{attachment:NIKA1mm-20111019s52_ph1.png | plateau in I}} {{attachment:NIKA1mm-20111019s52_ph2.png | plateau in Q}} The Mars map 20111019s52 in I and Q. ==== RZ, 5 Dec 2011 - Instabilities, changed flat field, nonlinearities ==== The correlation plots below show few examples of instabilities, changed flat field and nonlinearities of the 1mm signal {{attachment:NIKA1mm-20111018s159_instab.png}} {{attachment:NIKA1mm-20111019s6_instab.png}} {{attachment:NIKA1mm-20111019s78_instab.png}} {{attachment:NIKA1mm-20111022s75_instab.png}} {{attachment:NIKA1mm-20111023s30_notLin.png}} |
|
| Line 42: | Line 148: |
| [[attachment:NIKAv2_Grid_distortion.pdf | grid distortion ]] | [[attachment:NIKA_2011_grid_distortion.pdf | grid distortion ]] (updated Dec 1: 2 coefficients of the grid equation were switched) |
| Line 45: | Line 151: |
| ''FXD, 24 Nov 2011 updated v2 (Fits format exchange)'' [[attachment:NIKA2011_TechNote1_v2.pdf | Kid frequencies, fits format]] |
''FXD, 24 Nov 2011 updated v2.1 (v2.1 Modulation explanation added, v2 Fits format exchange, v1 Basic frequencies)'' ''FXD, 24 Jan 2012 updated v2.2 (v2.2 Polynomial fit explained, fits header inputs from Albrecht)'' [[attachment:NIKA2011_TechNote1_v2.2.pdf | Kid frequencies, fits format, polynomial fit]] |
| Line 52: | Line 159: |
| [[attachment:Calibration_sources_NIKA2011_and_PdB.xls | calibrators fluxes ]] ==== MC 24 Nov 2011 RF calculation on Mars ==== |
[[attachment:Calibration_NIKA_2010_2011_fluxes_fit_PdB.xls | Calibrators fluxes]] for Oct 2010 (run #2) and Oct 2011 (run #3), fitted on PdB database (updated Dec 14, 2011) ==== MC 30 Nov 2011 RF calculation on Mars ==== |
| Line 59: | Line 166: |
| ==== MC 24 Nov 2011 dIdQ modulation on strong sources ==== | ==== MC 30 Nov 2011 dIdQ modulation on strong sources ==== |
| Line 65: | Line 172: |
==== RZ, 30 Nov 2011 - Beam maps ==== To determine the pixel positions, the effective beam shapes and the flat field I used 9 Mars maps observed from Oct 17 to 22. Maps observed later on are of too bad quality. I could use sources weaker than Mars (Uranus, Neptune, ...) with sky noise filtering to determine the pixel positions & beams, but without the line-of-sight tau-corrections not to calculate the flat field. The pixels which show a clear cross-talk within the main beam were excluded. ==== FoV geometry ==== {{attachment:rpo1mmMeanEdge_1_9_with3_29.png | scatter of pixel positions}} {{attachment:avRPo1mmMeanEdge_1_9.png | average FoV 1mm}} The figure above left (scatter of pixel positions) shows the derived pixel positions in each of the maps. Different markers and colors correspond to different maps. The scatter of the positions is larger in the centre and in the upper(left) part of NIKA, i.e this cannot be an atmospheric effect (anomalous refraction). For the few examples I checked, the changed positions were due to a cross-talk. The resulting average pixel positions are shown above right (fig. average FoV 1mm). ==== Centre of Nasmyth rotation ==== One very important point cannot be properly checked using the available data: the centre of the Nasmyth rotation. This centre is defined by the rotation axis of the mirror M3, but its determination depends also on the pointing behaviour. The ultimate proof would be if all the usable pixels would always show the source at one position, i.e. independent of the elevation and azimut. For all coordinate transformations I had to assume this centre is close to pixel #21 (22 in my plots), as given by FXD. ==== Flat field ==== The correct flat field should be calculated for the main beams. However, because of the beam broadening (see below) I could use just the peak fluxes, i.e. a flat field valid only for on-offs observed with not filled receiver arrays like MAMBO, LABOCA or SCUBA. Currently I also did not use any extinction corrections. The average flat field shown below is therefore just indicative. {{attachment:ffMxAv.png | average flat field}} ==== Beam broadening ==== Strange beam broadening is visible both at 1 and 2mm. Two examples for Mars and Neptune are shown below. {{attachment:NIKA1mm-20111019s52_indFFmxRef22_1_rcp.png | beams 1mm Mars}} {{attachment:NIKA1mm-20111017s335_csf_indFFmxRef22_2_rcp.png | beams 1mm Neptune}} Note the larger and elliptical beams of pixels #29 and 40 for Neptune. This is an effect of the cross-talk. The beam broadening is visible also in I & Q (below) and at 2mm (not shown). {{attachment:NIKA1mm-20111019s52_indFFmxRef22_ph1_1_rcp.png | beam broadening in I}} {{attachment:NIKA1mm-20111019s52_indFFmxRef22_ph2_1_rcp.png | beam broadening in Q}} Below the beam sizes @1mm during run 2 are shown for comparison. {{attachment:NIKA1mm-20101020s226_avFFgf_ref2mm_rcp.png | FoV and beams 1mm run2}} ==== Average beam sizes ==== For pointing sources weaker than roughly Neptune the errors of individual beams are too large to allow the check of the beam change across the FoV. Only the average beam shape can be fitted with sufficient accuracy. The figure below shows the major (triangles) and minor (circles) FWHM for all pointing sources available in the IMBFits format. There is a clear change of the observed beam size after the pointing run, but within the errors no dependence on the source flux. The reason for the smaller FWHM during the pointing run is not clear to me. The bad tracking of the sources (recall: the pointing run was performed with Nasmyth offsets of EMIR) could explain only an increase of the major axis (a kind of a "comet"-effect) but not the decrease of the minor axis. However, as SL pointed, it was discovered on 18th that the mirror M7 was moved. The change of the FWHM corresponds to the re-adjustement of M7. Is this just a coincidence or the explanation for the changed average FWHM ? The change of the FWHM across the FoV is definitely not related to the M7 problem - it was present before and after the re-adjustment of M7. {{attachment:fwhm1mmMJD.png | major and minor source sizes}} ==== Origin of the large pointing errors ==== All the errors and effects shown above: scatter of the pixel positions, effect of the focus, imperfect pointing model a.s.o., cannot explain the very large (>10arcsec) pointing offsets. There must be still another problem I could not identify. ==== RZ, 1 Dec 2011 - The ''plateau'' ==== {{attachment:NIKA1mm-20111019s52_2_Jy.png | plateau all pixs Jy}} {{attachment:NIKA1mm-20111019s52_Jy_rows.png | plateau rows Jy}} {{attachment:NIKA1mm-20111019s52_Jy_cols.png | plateau columns Jy}} {{attachment:NIKA1mm-20111019s52_ph1.png | plateau in I}} {{attachment:NIKA1mm-20111019s52_ph2.png | plateau in Q}} |
==== MC 07 Dec 2011 More comments on RF calculations ==== {{attachment:ampl_IQ5.jpg| Amplitude IQ, pixel 5 | width=400}} {{attachment:ampl_dIdQ5.jpg| Amplitude dIdQ, pixel 5 | width=400}} {{attachment:RFdIdQ_vs_RF_fit5.jpg| RF from CAMADIA vs RF from fit, pixel 5 | width=400}} {{attachment:ampl_IQ37.jpg| Amplitude IQ, pixel 37 | width=400}} {{attachment:ampl_dIdQ37.jpg| Amplitude dIdQ, pixel 37 | width=400}} {{attachment:RFdIdQ_vs_RF_fit37.jpg| RF from CAMADIA vs RF from fit, pixel 37 | width=400}} The RF variation calculated by CAMADIA can differ from that obtained by a 2d fit used to find a relation F(I, Q). This in any case generally happens only for very strong signals (Mars, essentially...) and only for the pixels that happen to be already slightly distorted or in any case biased really to their limit. The images show 2 different pixels during a Mars observation. It can be seen that the one where there is a disagreement between RFdIdQ as evaluated by CAMADIA (blue line) and the one by the fit (red line) is the pixel with a distorted resonance (kid 5). ==== FXD 16 Dec 2011 Happy new year to the NIKA team : DR21 and DR21(OH) Preliminary data reduction (Sky noise decorrelation and then High-pass filtering by one subscan length) ==== {{attachment:Map2Radec2_AB_DR21_20111020_247_247b.gif| DR21 at 1 and 2mm | width=400}} {{attachment:Map2Radec2_AB_DR21_OH_20111020_248_248.gif| DR21(OH) at 1 and 2mm | width=400}} ==== Nico 21 Dec 2011: Double resonnance separation + focal plane characterization ==== Here is a brief note on detectors decoupling and focal plane parameters reconstruction. Results are summarized in .fits files, one per configuration. I've only run the pipeline on two nights of observation for now but will update the list shortly. Comments on this preliminary work very much welcome. Merry christmas to you all ! [[attachment:FP_quicklook_111212.pdf | FP_quicklook_111212.pdf]] [[attachment:d_2011_10_18_00h29m35_Uranus_333_FP_AB.fits | d_2011_10_18_00h29m35_Uranus_333_FP_AB.fits]] [[attachment:d_2011_10_19_23h14m23_Uranus_220_FP_AB.fits | d_2011_10_19_23h14m23_Uranus_220_FP_AB.fits]] ==== Nico 08 Feb 2012: update on focal plane characterization and distortions ==== Looking at 4 different OTF_Geometry scans throughout the calibration campaign, I compare focal plane reconstructions : they are very stable. I also look at the beam distortion pattern and show that it correlates very well to optical distortions. Comments welcome. [[attachment:FP_quicklook_120207.pdf | FP_quicklook_120207.pdf]] |
NIKA3 Offline Processing Results
2011 October run
=Private results for the collaboration only=
Public results
List of offline processing tasks
FXD, 24 Oct 2011 - Photometric quality
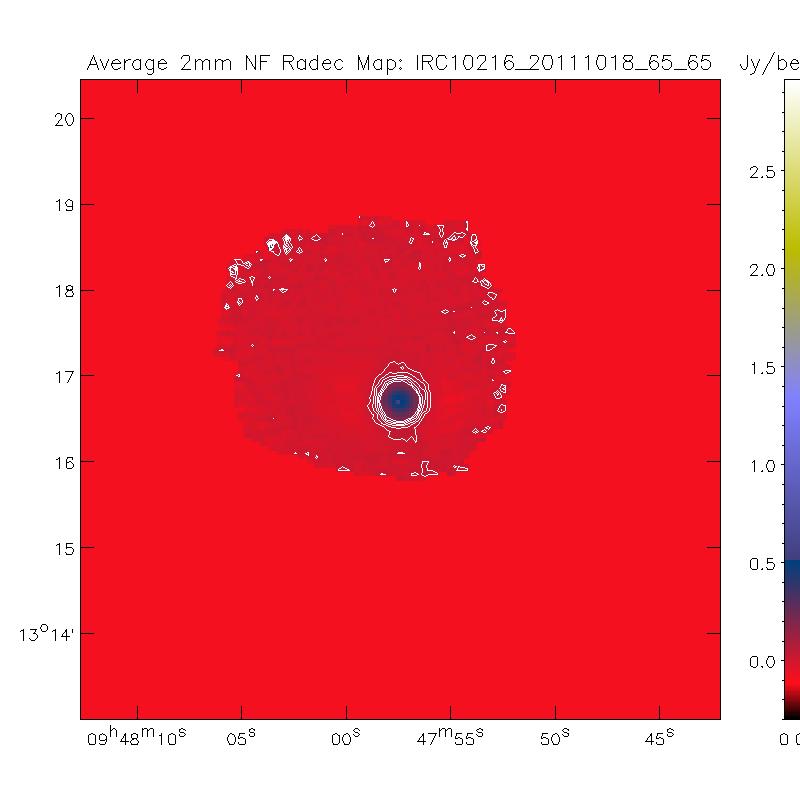
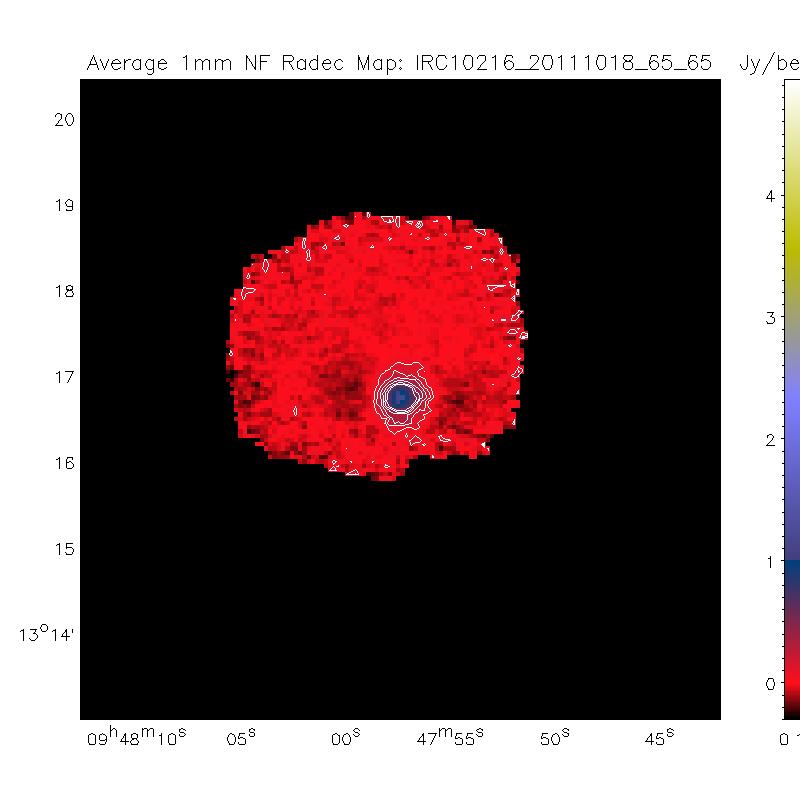
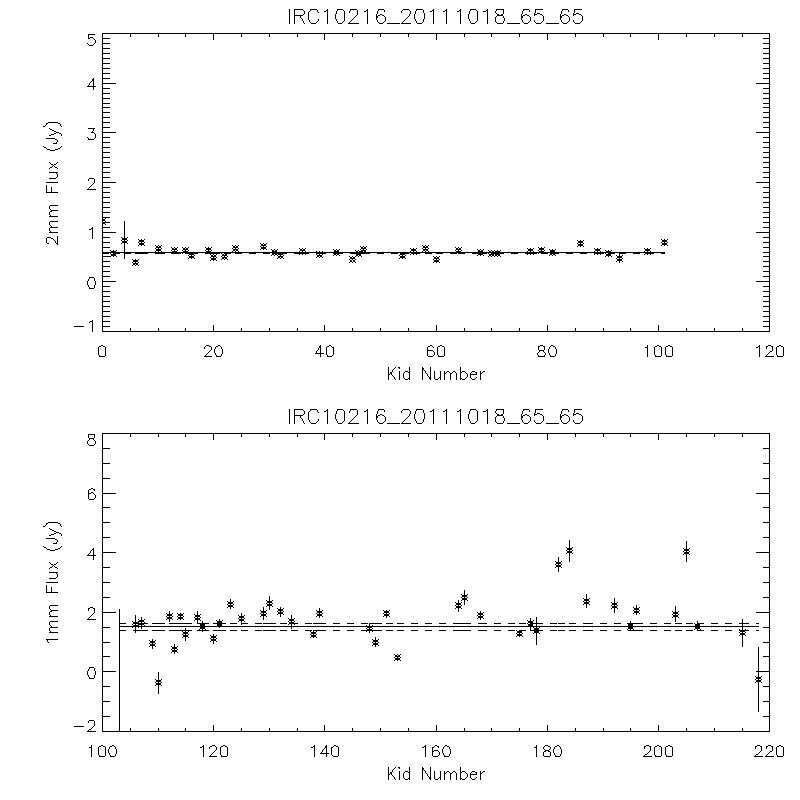
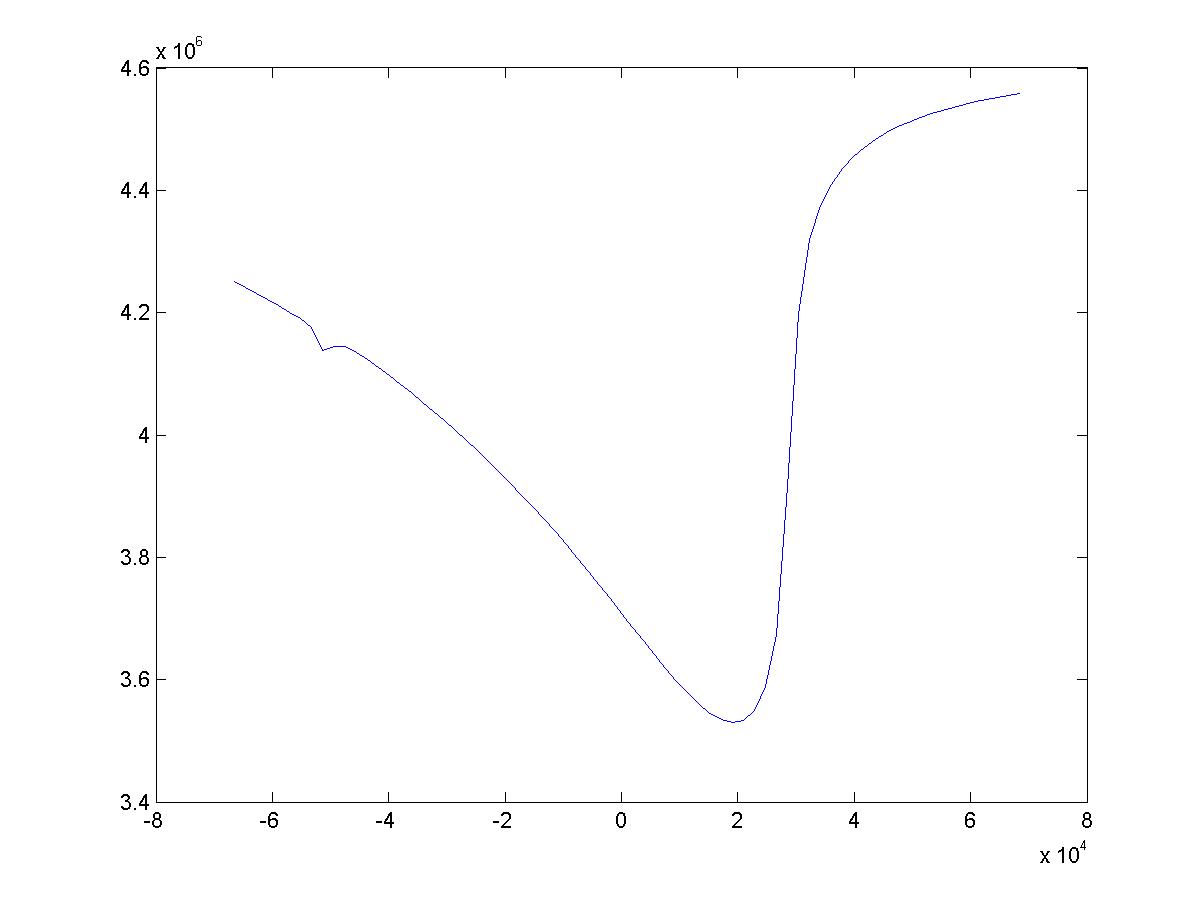
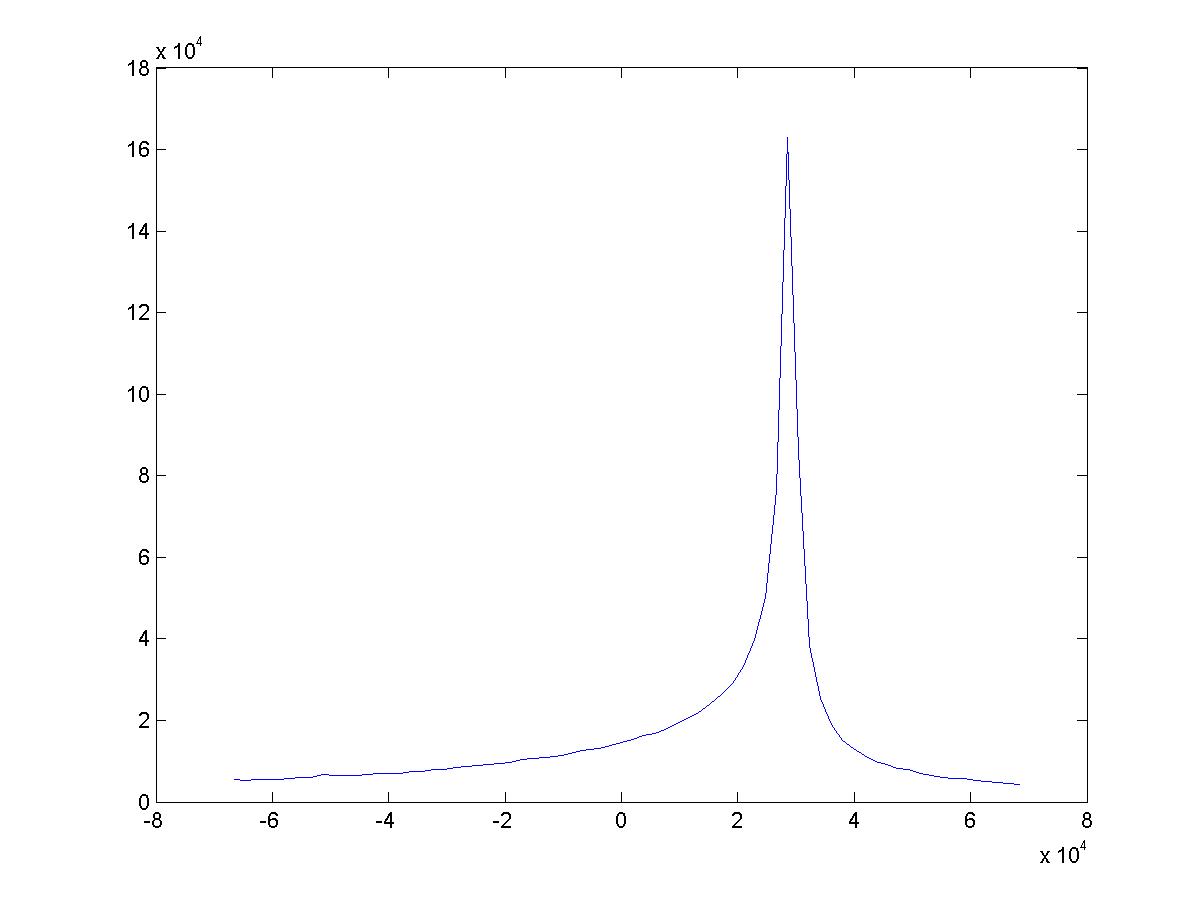
Here are the maps obtained on one OTF scan with IRC 10216. Sky noise decorrelation is used.
|
|
The flux per kid is shown here using the calibration on Mars Scan #55. This is an indication that the new camera with its dIdQ modulation scheme provides a big photometric improvement with respect to 2010 campaign. The average flux is compatible with the range of fluxes measured on this (variable) source.
RZ, 25 Nov 2011 - Pointing & focus effects
To derive the source positions I used the pointing maps available in the IRAM Multi Beam FITS (IMBFits) format. However, currently over 20% of the pointing are missing. The statistics shown below is therefore represantative but by far not complete.
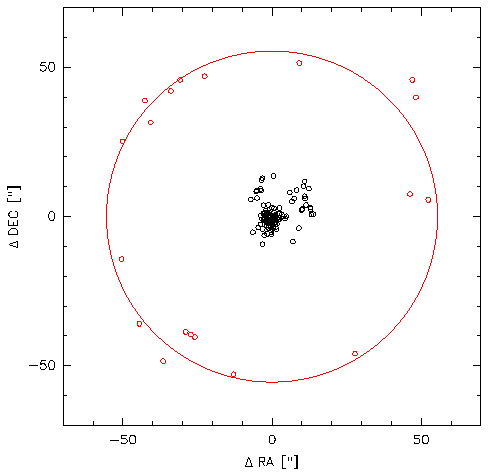
Source positions in the eq offsets. Positions of planets are not shown. In red are shown positions of sources used for the pointing model, in black after the installation of the pointing model. The pointing run was apparently performed with Nasmyth offsets of EMIR ! The pointing offsets after the installation of the pointing model are still very large, even 3-5 times larger than the normal values.
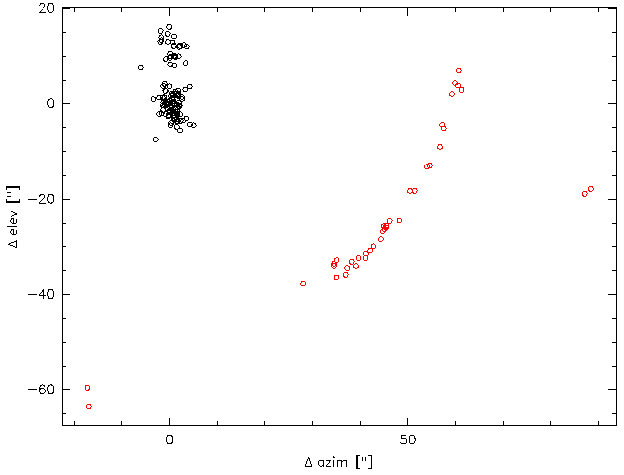
As above in the hor system; positions of planets are also shown.
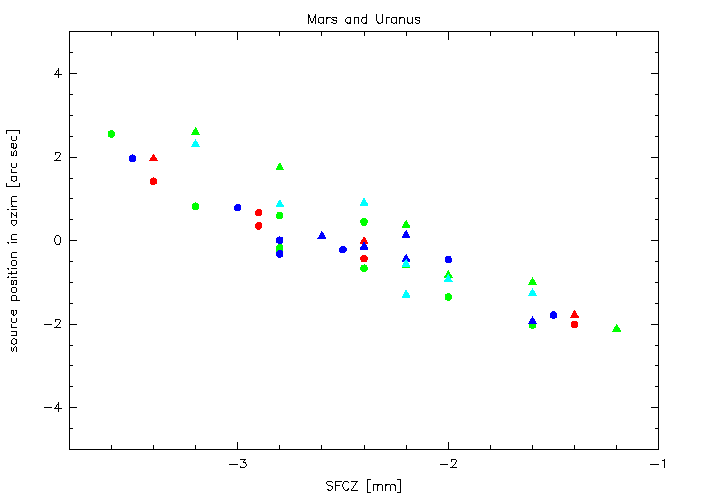
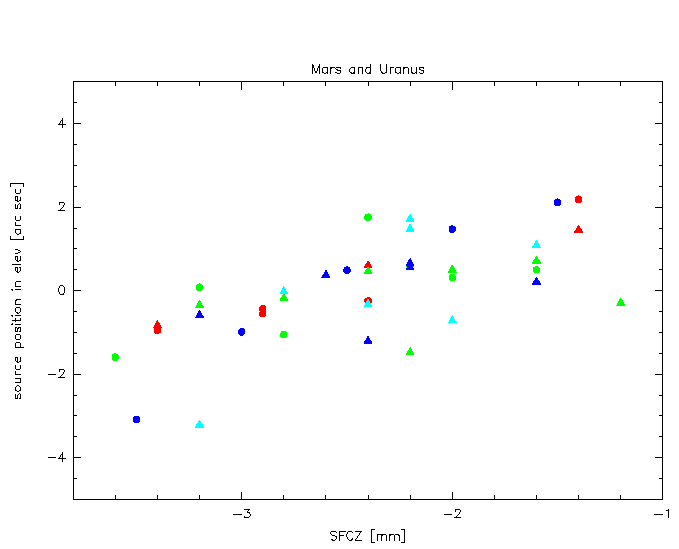
Effekt of defocusing: the source moves by a couple of arcsec in azim & elev. Note the larger scatter of the elev-positions.
Both, the pointings and foci were done by mapping. However, to correctly process maps the correct beam parameters, i.e. the pixel positions and their flat field are mandatory. The effective FoV geometry, the flat field and their errors will come next.
Origin of the large pointing errors
All the errors and effects shown above: scatter of the pixel positions, effect of the focus, imperfect pointing model a.s.o., cannot explain the very large (>10arcsec) pointing offsets. There must be still another problem I could not identify.
Update Feb 9:
To search for the source of the large pointing errors (and bimodal distribution in elev) I analysed also the pointings obtained with the heterodyne receivers. The poitings during the campaign are of mediocre quality but indicated some strange arcs in the plane (azCorrection,elCorrection). This finding is further confirmed by the (much clearer) examples below. Such a pointing behaviour of the telescope is new. pointing_corr_EMIR.png
RZ, 30 Nov 2011 - Beam maps
To determine the pixel positions, the effective beam shapes and the flat field I used 9 Mars maps observed from Oct 17 to 22. Maps observed later on are of too bad quality. I could use sources weaker than Mars (Uranus, Neptune, ...) with sky noise filtering to determine the pixel positions & beams, but without the line-of-sight tau-corrections could not calculate the flat field. The pixels which show a clear cross-talk within the main beam were excluded.
FoV geometry
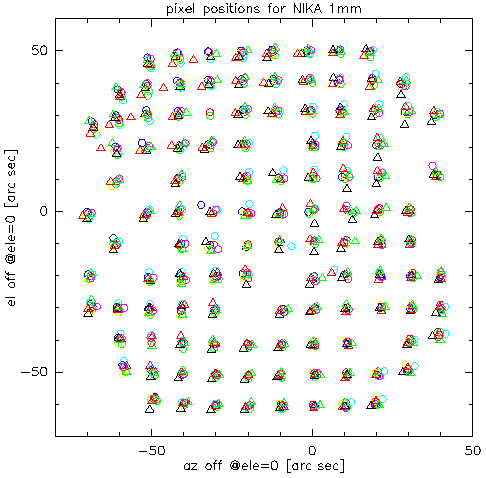
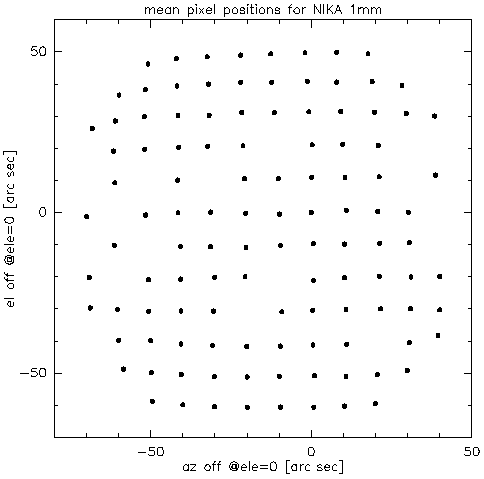
The figure above left (scatter of pixel positions) shows the derived pixel positions in each of the maps. Different markers and colors correspond to different maps. The scatter of the positions is larger in the centre and in the upper(left) part of NIKA, i.e this cannot be an atmospheric effect (anomalous refraction). For the few examples I checked, the changed positions were due to a cross-talk. The resulting average pixel positions are shown above right (fig. average FoV 1mm).
Centre of Nasmyth rotation
One very important point cannot be properly checked using the available data: the centre of the Nasmyth rotation. This centre is defined by the rotation axis of the mirror M3, but its determination depends also on the pointing behaviour. The ultimate proof would be if all the usable pixels would always show the source at one position, i.e. independent of the elevation and azimuth. For all coordinate transformations I had to assume this centre is close to pixel #21 (22 in my plots), as given by FXD.
Flat field
Update Dec 7: flat field for the beams in the near field.
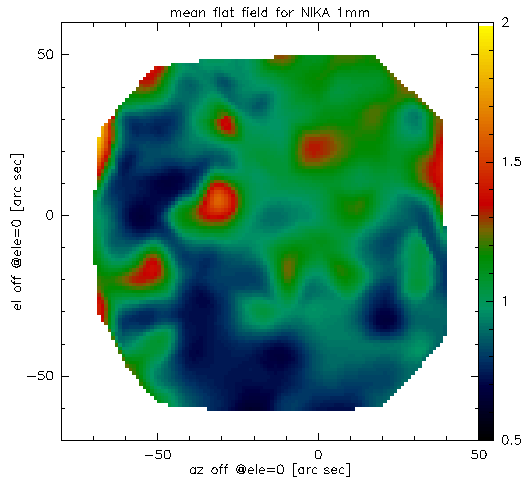
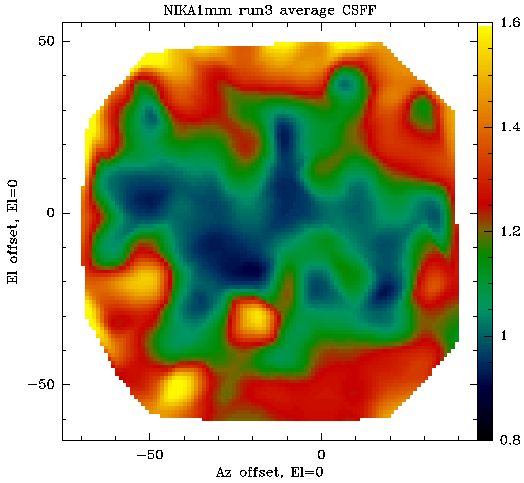
Two flat fields are necessary for the data processing: for the far field (i.e. main beam = astronomical sources, MBFF) and for the near field (sky noise, i.e. the correlated signal, CSFF). The correct main beam flat should use integrals over the main beams. However, because the reason(s) for the beam broadening (see below) are not clear to me, I used just the peak fluxes, i.e. a flat field (PFFF) valid only for on-offs observed with not filled receiver arrays like MAMBO, LABOCA or SCUBA. Currently I also did not use any extinction corrections. The peak flux flat field shown below is therefore just indicative.
To calculate the flat for the beams in the near field in higher than first order approximation, just the slopes of the correlation distributions in data of weak sources are sufficient, i.e. when the assumption noise=data can be made (see "5 Dec 2011 - Instabilities, changed flat field, ..." below). Note that the calculation of the CSFF does not need any beam sizes.
Whereas each of the flat fields depends on the pixel response to the incoming signal, the ratio of the flat fields does not. In the no-problem case the ratio of the flat fields shows simply the change of the coupling of the receiver to the telescope. It may vary, e.g. due to a distortion of the FoV, but this variation cannot explain the observed ratios of ~200%.
Beam broadening
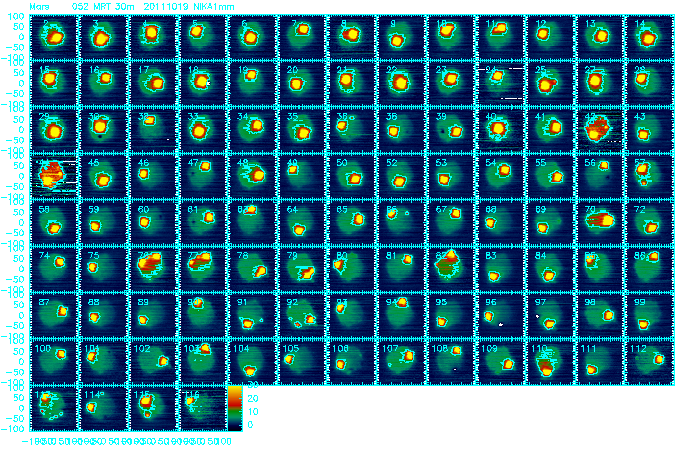
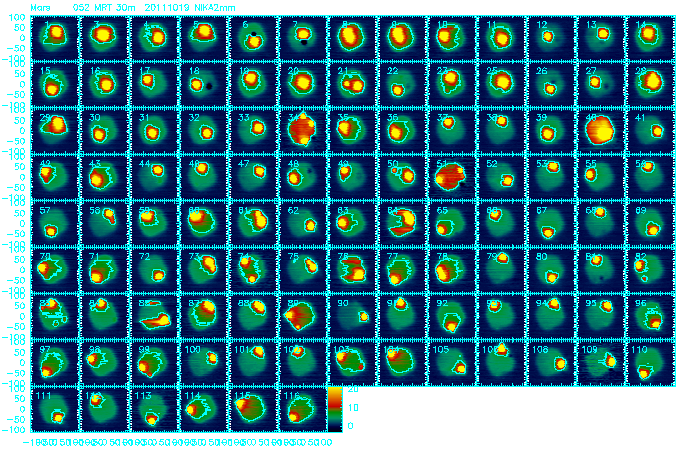
Strange beam broadening is visible both at 1 and 2mm. Two examples for Mars and Neptune are shown below.
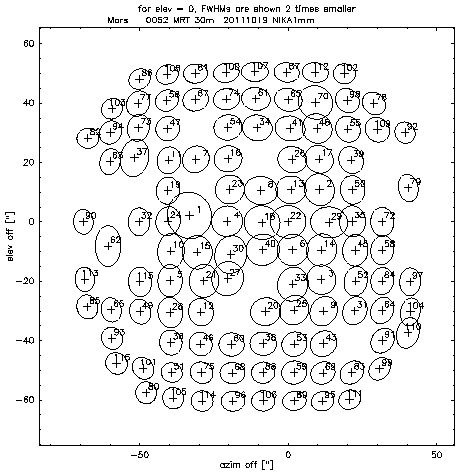
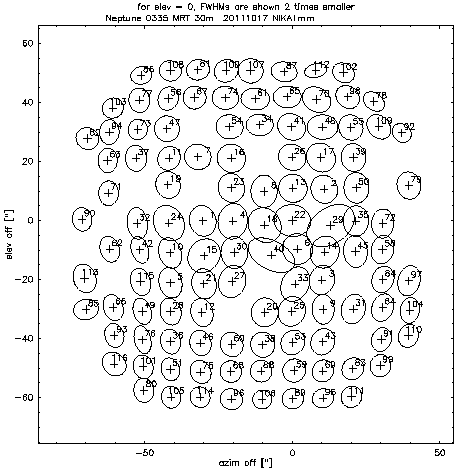
Pixel #1 is not reliable. Note also the larger and elliptical beams of pixels #29 and 40 for Neptune. This is an effect of the cross-talk.
The beam broadening is visible also in I & Q (below) and at 2mm (not shown).
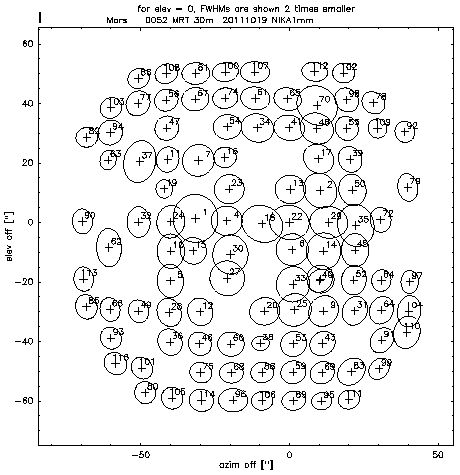
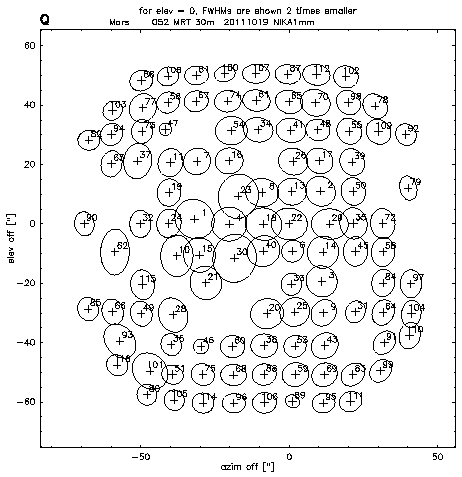
For comparison, below are shown the beam sizes @1mm during run 2.

Update Dec 9:
The beam broadening shows also a quite clear dependence on the pixel number. Below are shown the average FWHM of two first Mars maps @1mm.
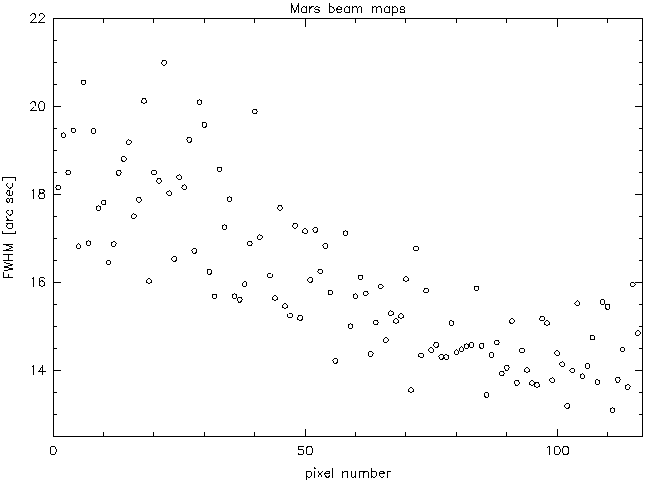
We can therefore ask: is the beam broadening a function of the pixel number, the FoV distribution therefore just a result of the choice of the pixel position, or vice versa ?
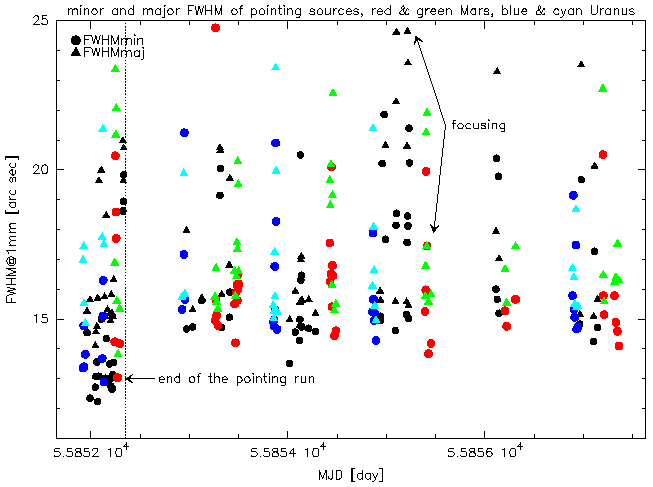
Average beam sizes
For pointing sources weaker than roughly Neptune the errors of individual beams are too large to allow the check of the beam change across the FoV. Only the average beam shape can be fitted with sufficient accuracy. The figure below shows the major (triangles) and minor (circles) FWHM for all pointing sources available in the IMBFits format. There is a clear change of the observed beam size after the pointing run, as after the pointing run the sources appeared at different region of NIKA (recall: the pointing run was performed with the Nasmyth offsets for EMIR). This change is therefore an effect of the variation of the FWHM across the FoV. Within the errors there is no dependence of the FWHM on the source flux.
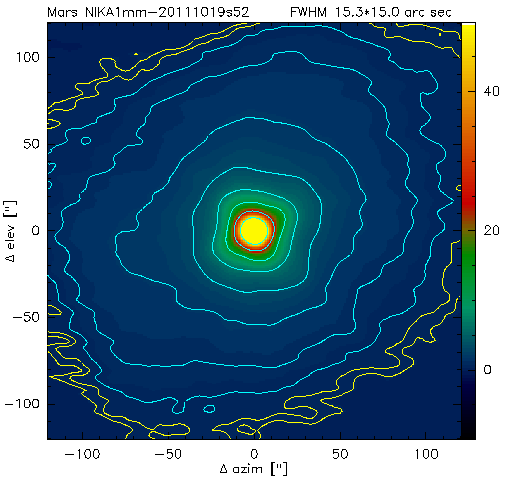
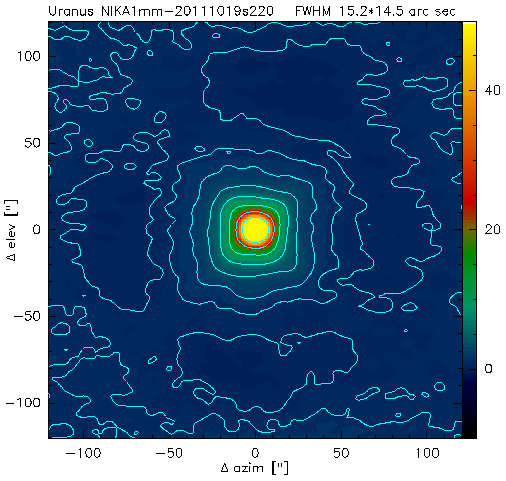
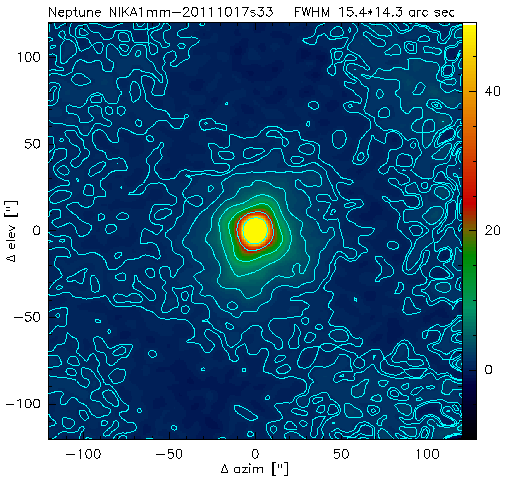
Example beam maps obtained on Mars (~160Jy), Uranus (~33.5Jy) and Neptune (~12.6Jy) with NIKA1mm are show below. The contour levels are at 0.4, 0.8, 1.6 ... 25.6 and 50%, for Mars also at 0.1 and 0.2% (in yellow). The averaged FWHM is in all cases ~15arcsec.
RZ, 1 Dec 2011 - The ''plateau''
Update Dec 7: figures @2mm
Details of the plateau. The intensity scale is Jy/beam. The contour @1mm is at 9.5Jy/beam, @2mm 6.7y/beam.

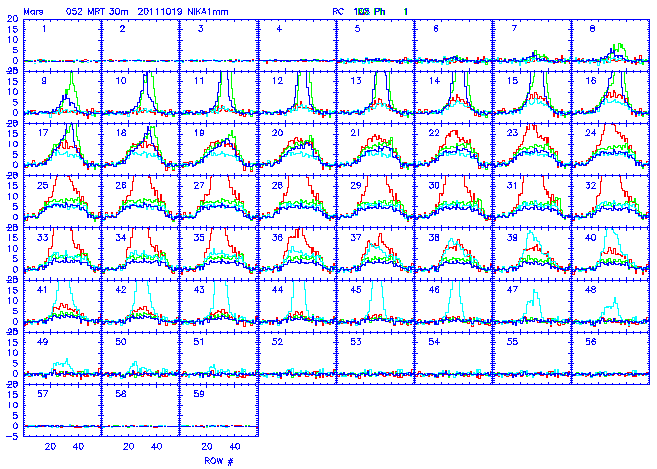
Intensity profiles @1mm per row (i.e. along the azimuth) and column (i.e. along the elevation) of pixels #22 (in red), #80 (in green), #102 (in cyan) and #105 (in blue).
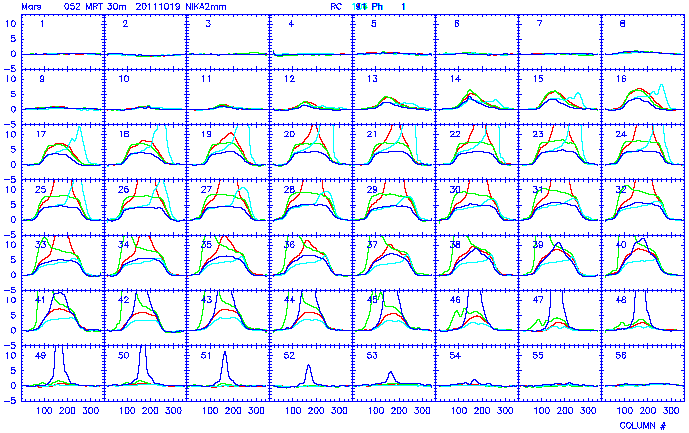
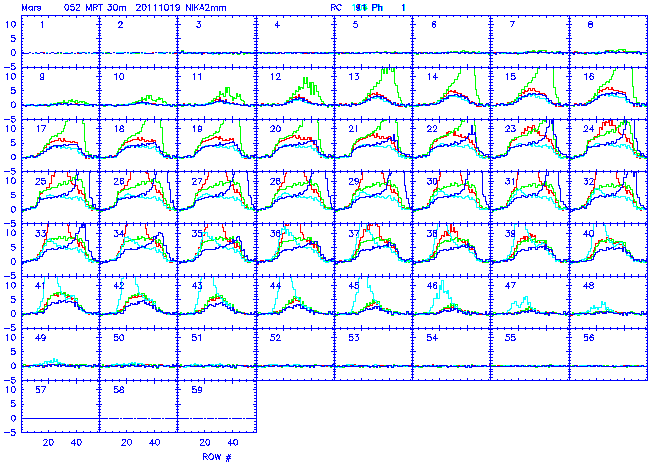
Intensity profiles @2mm per row (i.e. along the azimuth) and column (i.e. along the elevation) of pixels #11 (in red), #104 (in green), #105 (in cyan) and #91 (in blue).
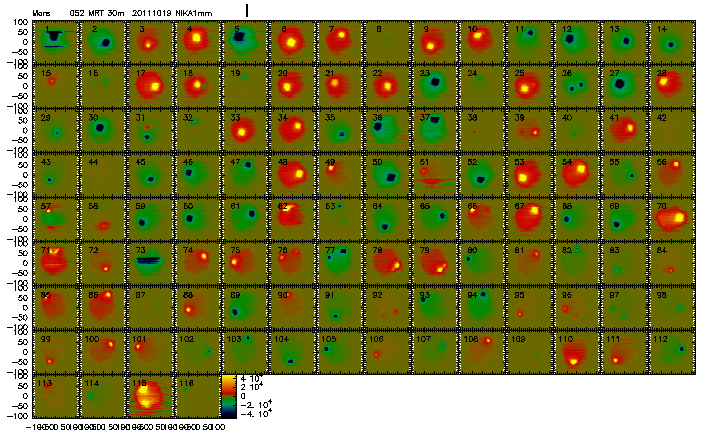
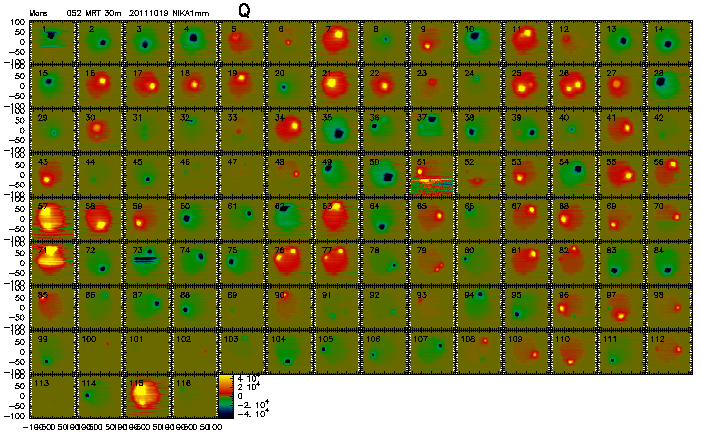
The Mars map 20111019s52 in I and Q.
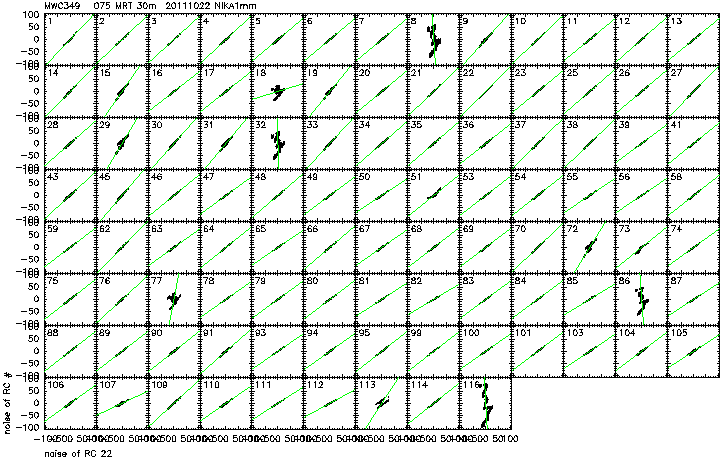
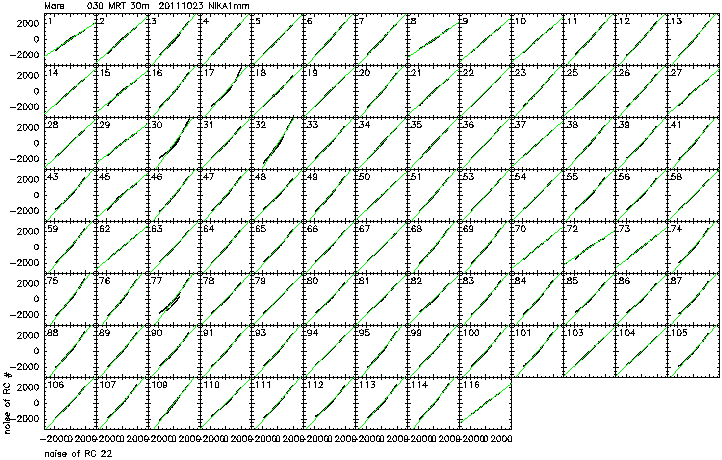
RZ, 5 Dec 2011 - Instabilities, changed flat field, nonlinearities
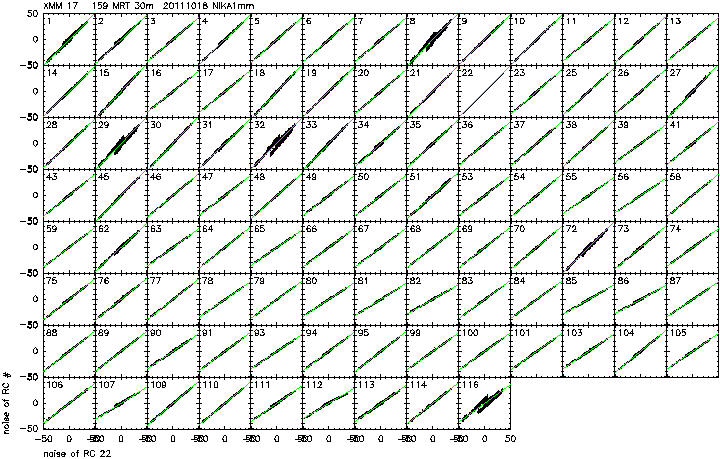
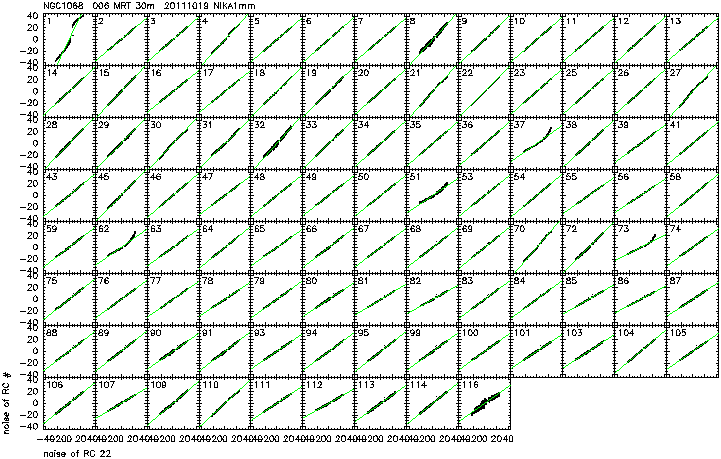
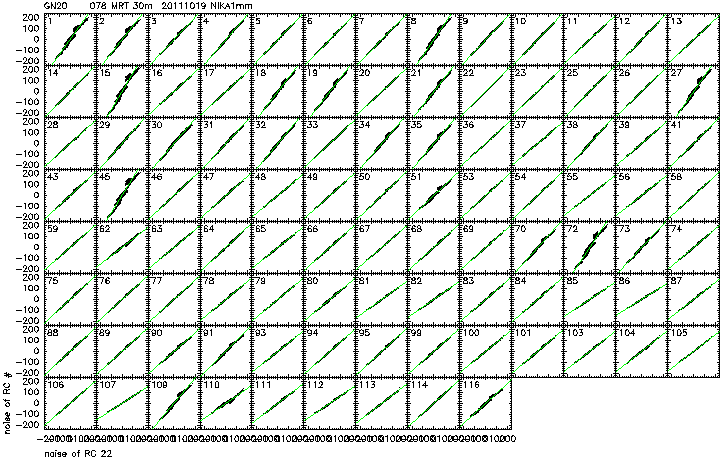
The correlation plots below show few examples of instabilities, changed flat field and nonlinearities of the 1mm signal
SL, 07 Nov 2011 - Expected field distortion
grid distortion (updated Dec 1: 2 coefficients of the grid equation were switched)
FXD, 21 Nov 2011 - Technical note on kid frequencies
FXD, 24 Nov 2011 updated v2.1 (v2.1 Modulation explanation added, v2 Fits format exchange, v1 Basic frequencies) FXD, 24 Jan 2012 updated v2.2 (v2.2 Polynomial fit explained, fits header inputs from Albrecht)
Kid frequencies, fits format, polynomial fit
AM,MC 24 Nov 2011 Spectral transmissions
![]()
SL, 30 Nov 2011 - Calibration sources with PdB flux references
Calibrators fluxes for Oct 2010 (run #2) and Oct 2011 (run #3), fitted on PdB database (updated Dec 14, 2011)
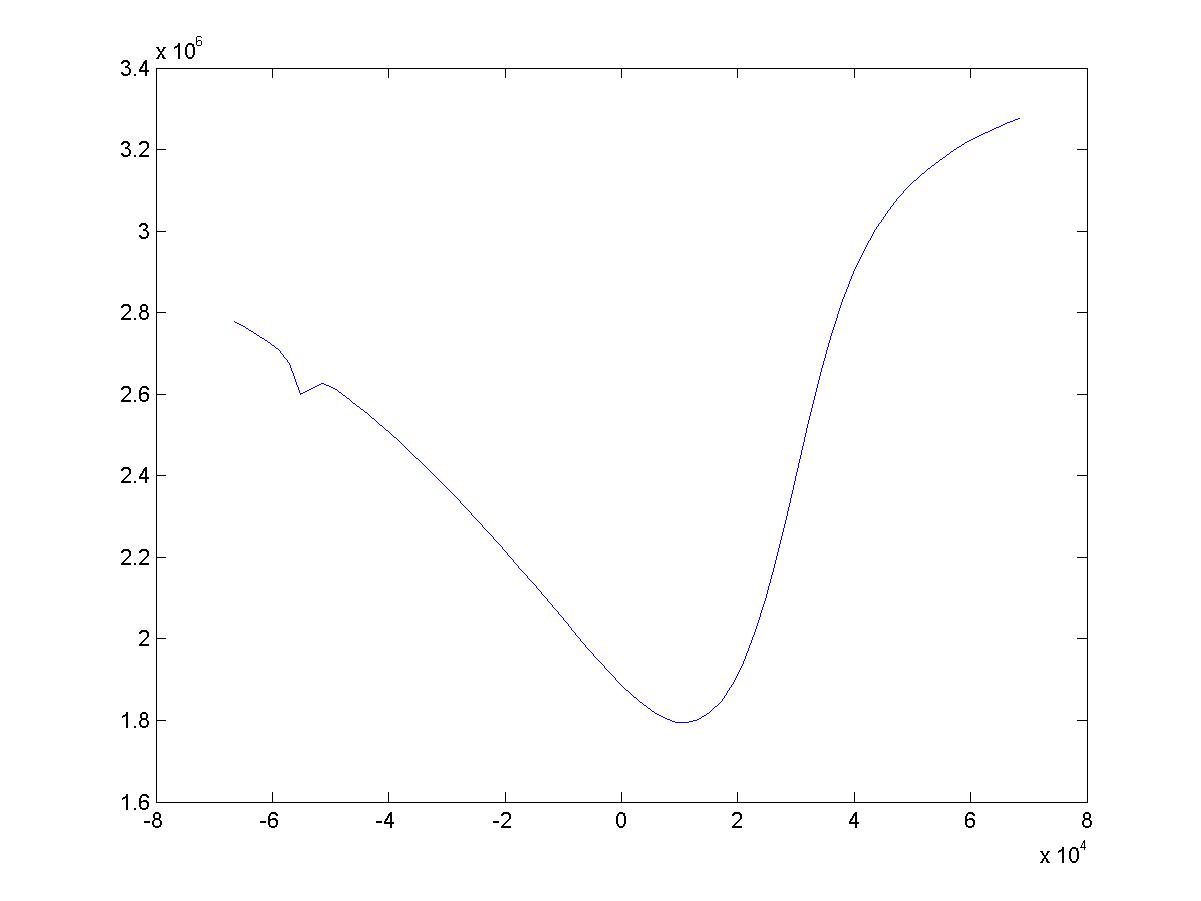
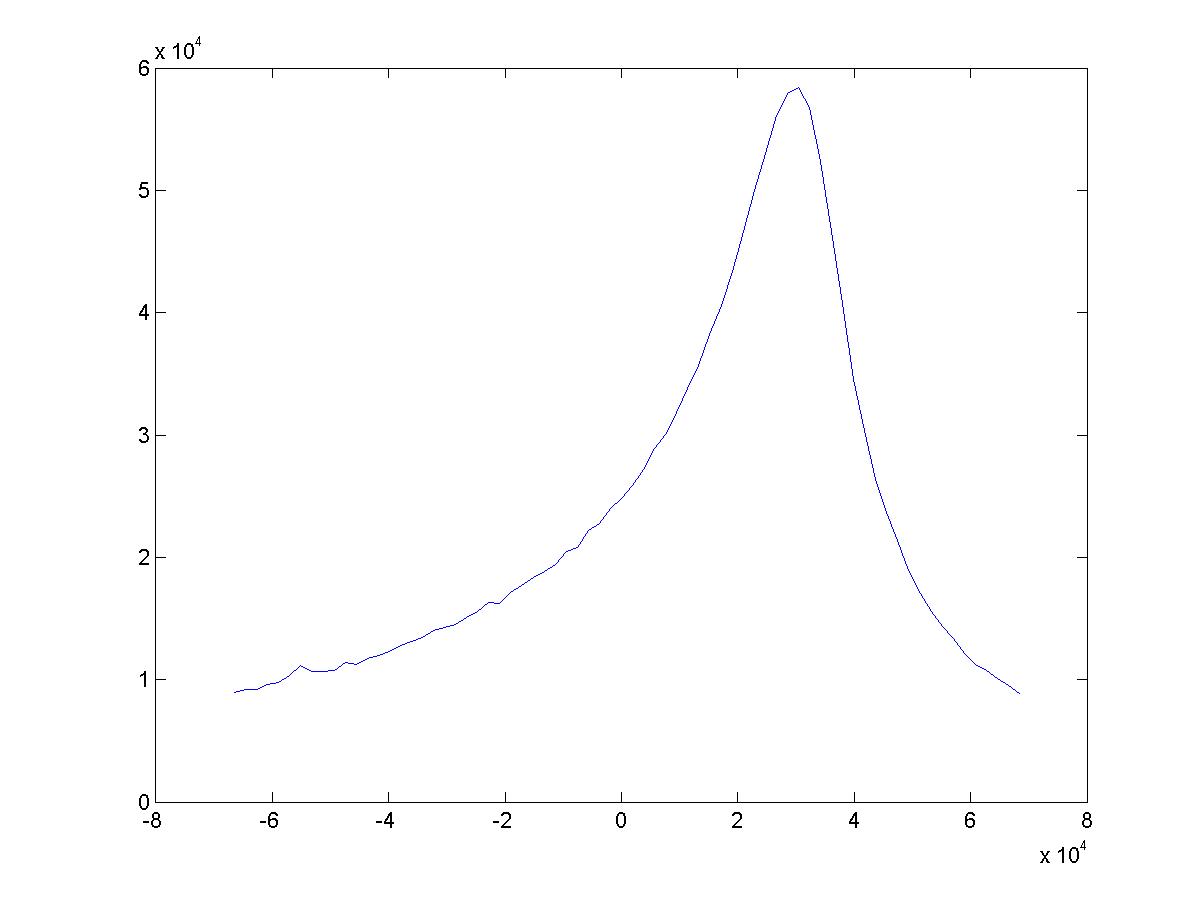
MC 30 Nov 2011 RF calculation on Mars
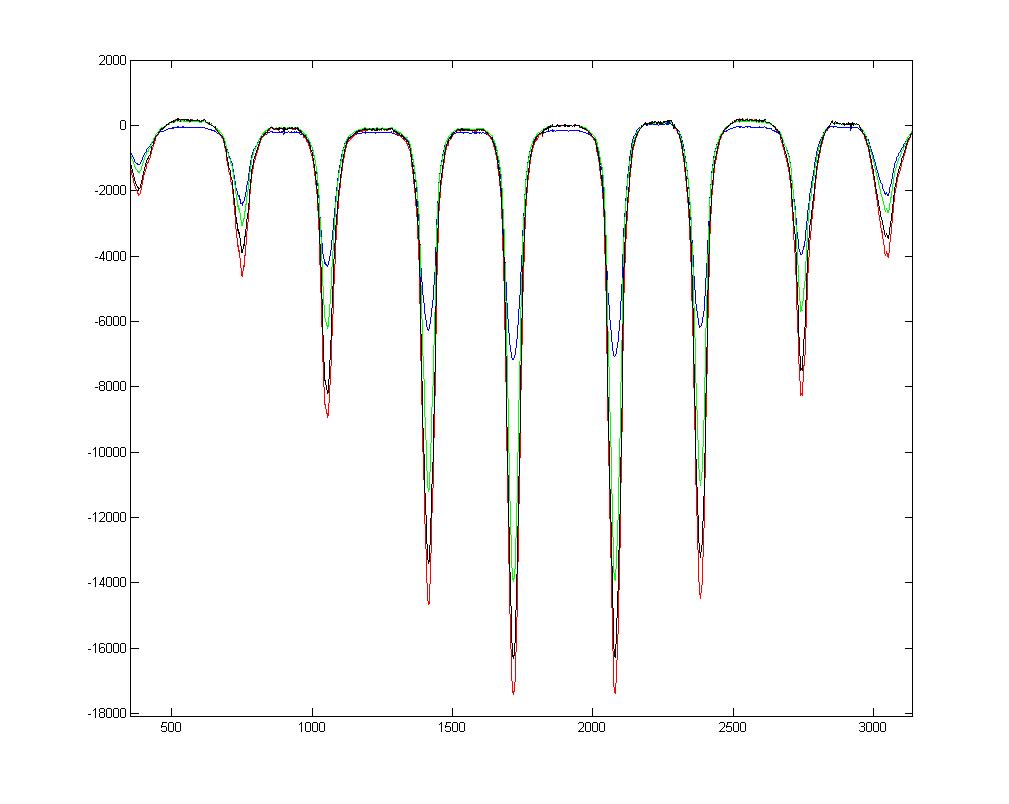
Blue line is the RFdIdQ as calculated in the standard way. Red, green and black are the results obtained using a 2-d polinomial fit of grade 2, 3 and 4 respectively.
MC 30 Nov 2011 dIdQ modulation on strong sources
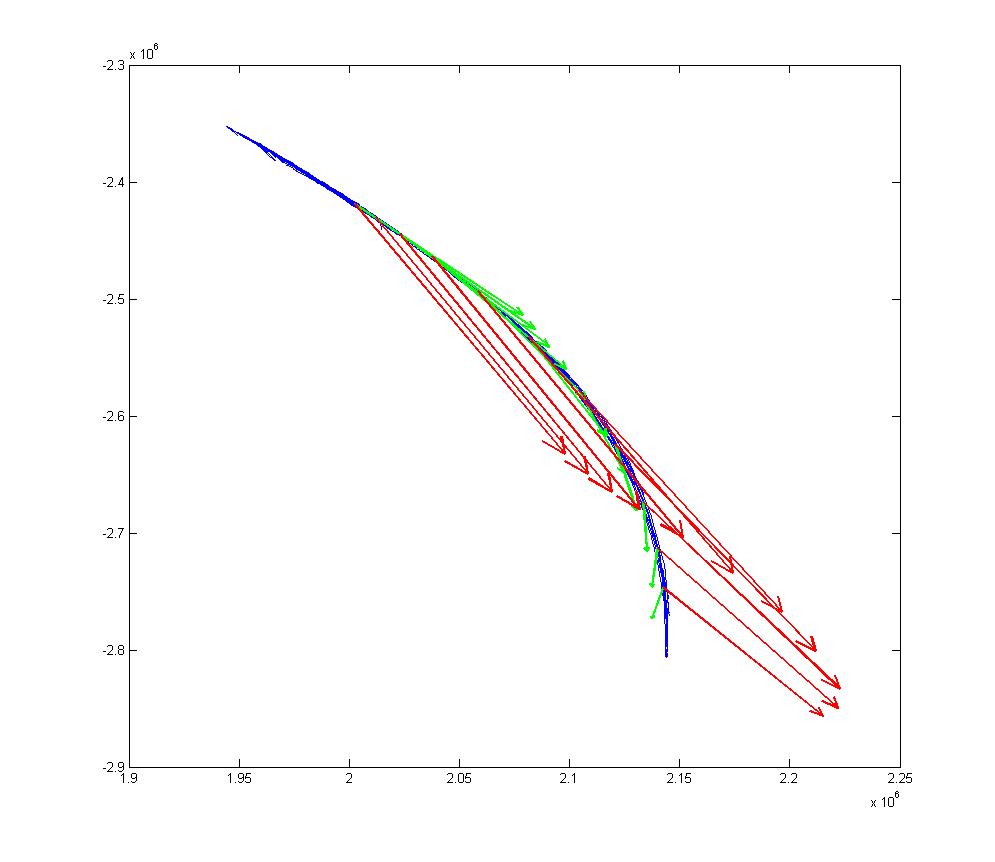
The blue line is the trajectory on the IQ plane when observing mars (approx 7kHz signal). The red line is the observed DeltaI, DeltaQ, averaged on 100 points (please do not consider it. It doesn't have a lot of sense. I'll update.). Interesting are the green arrows, whiwh are the dI dQ obtained by the LO modulation: near the peak of the source, where we get far from the resonances, they get farther from the tangent of the IQ trajectory... to be investigated!
MC 07 Dec 2011 More comments on RF calculations
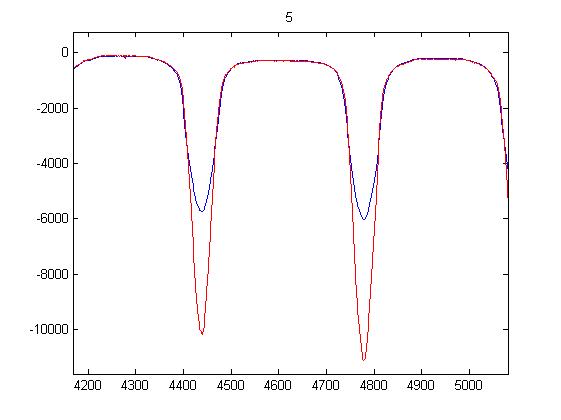
The RF variation calculated by CAMADIA can differ from that obtained by a 2d fit used to find a relation F(I, Q). This in any case generally happens only for very strong signals (Mars, essentially...) and only for the pixels that happen to be already slightly distorted or in any case biased really to their limit. The images show 2 different pixels during a Mars observation. It can be seen that the one where there is a disagreement between RFdIdQ as evaluated by CAMADIA (blue line) and the one by the fit (red line) is the pixel with a distorted resonance (kid 5).
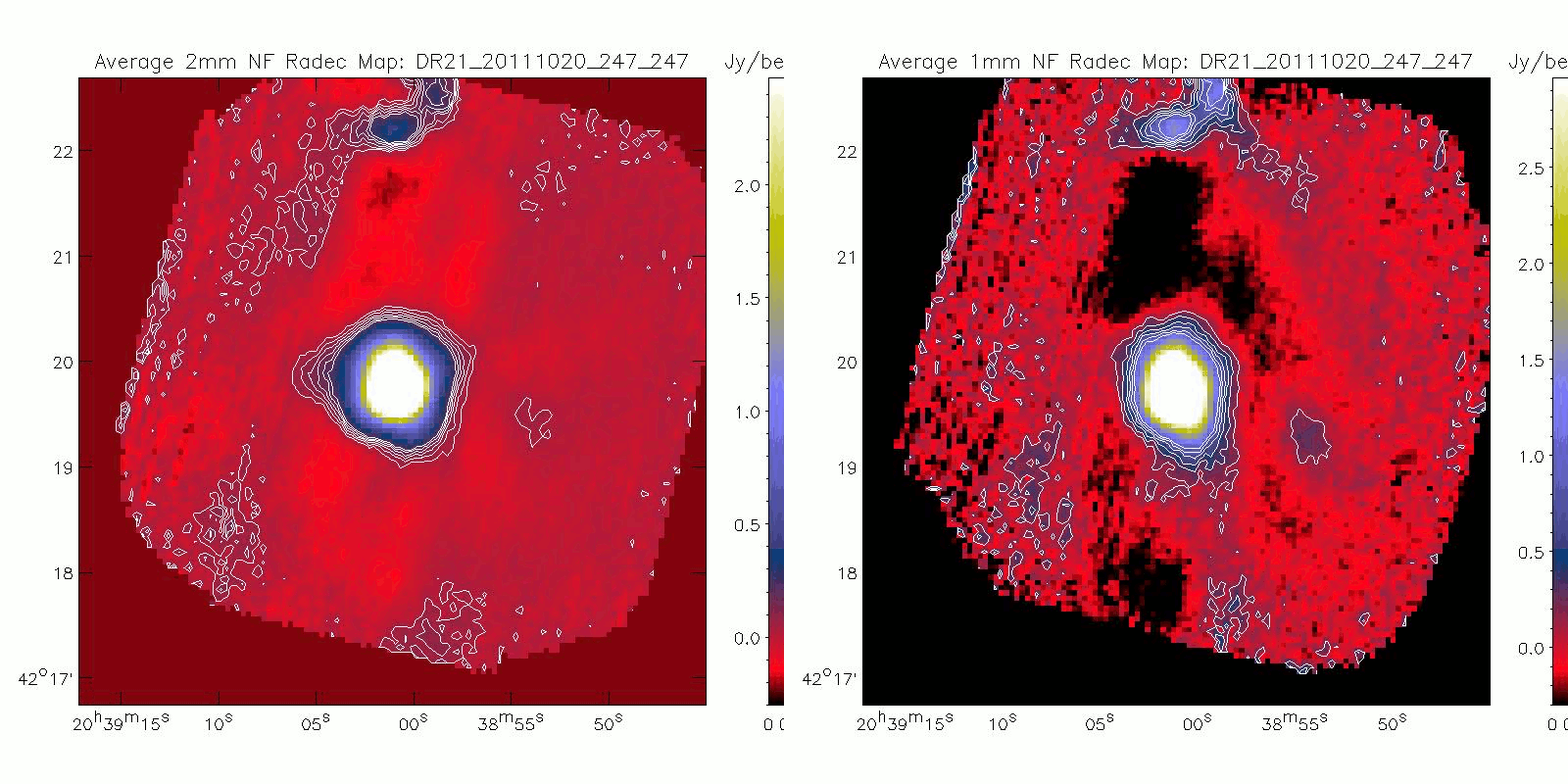
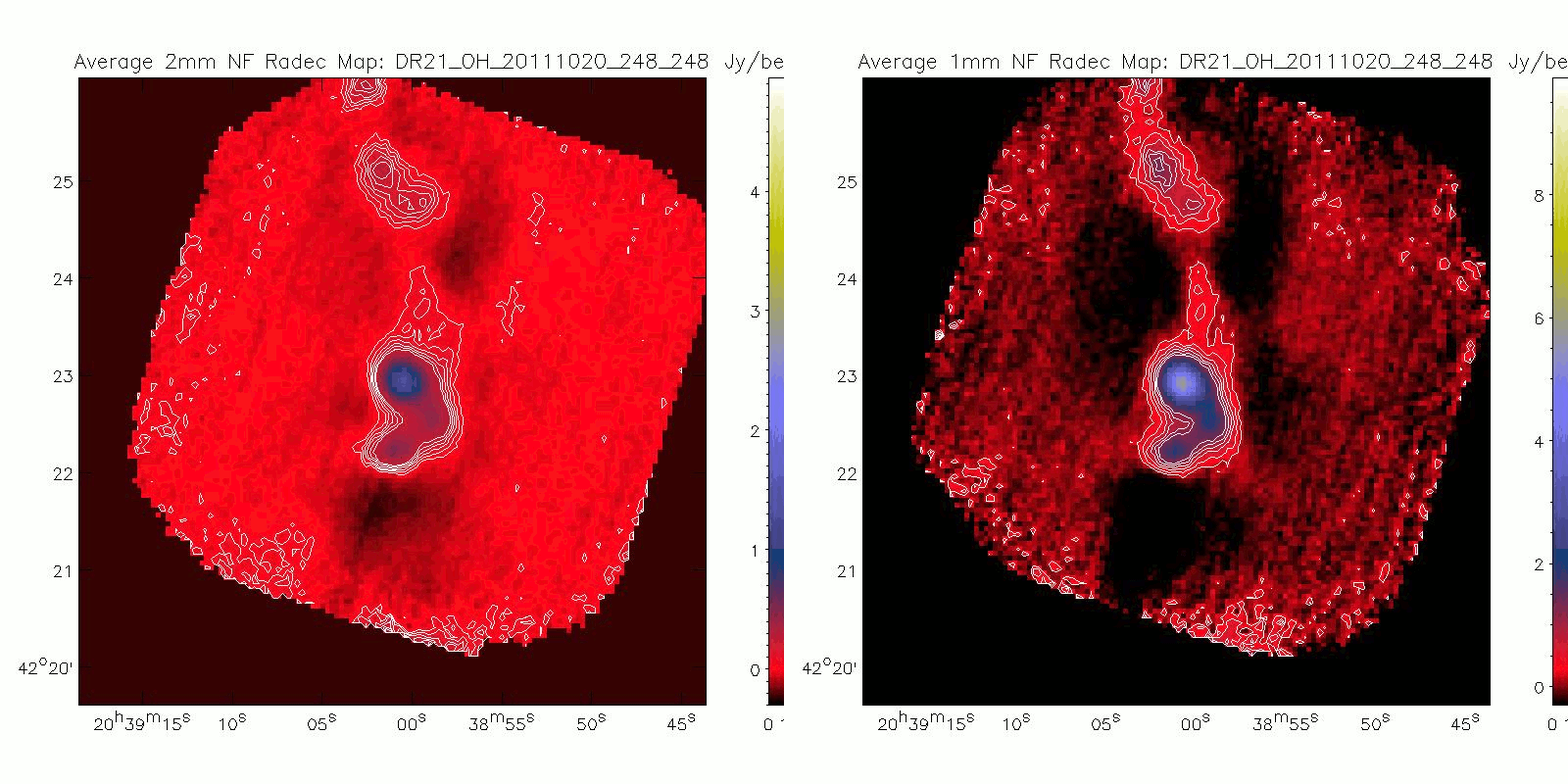
FXD 16 Dec 2011 Happy new year to the NIKA team : DR21 and DR21(OH) Preliminary data reduction (Sky noise decorrelation and then High-pass filtering by one subscan length)
Nico 21 Dec 2011: Double resonnance separation + focal plane characterization
Here is a brief note on detectors decoupling and focal plane parameters reconstruction. Results are summarized in .fits files, one per configuration. I've only run the pipeline on two nights of observation for now but will update the list shortly. Comments on this preliminary work very much welcome. Merry christmas to you all !
FP_quicklook_111212.pdf d_2011_10_18_00h29m35_Uranus_333_FP_AB.fits d_2011_10_19_23h14m23_Uranus_220_FP_AB.fits
Nico 08 Feb 2012: update on focal plane characterization and distortions
Looking at 4 different OTF_Geometry scans throughout the calibration campaign, I compare focal plane reconstructions : they are very stable. I also look at the beam distortion pattern and show that it correlates very well to optical distortions. Comments welcome.

