|
Size: 477
Comment:
|
Size: 4049
Comment:
|
| Deletions are marked like this. | Additions are marked like this. |
| Line 8: | Line 8: |
| FXD, 24 Oct 2011 - Photometric quality\\ Here are the maps obtained on one OTF scan with IRC 10216 |
[[NIKA3ListOfflineProcTask| List of offline processing tasks]] |
| Line 11: | Line 10: |
| ||{{attachment:Map2Radec2_A_IRC10216_20111018_65_65.jpg|IRC 10216 Scan65 18th 2mm map}}||{{attachment:Map2Radec2_B_IRC10216_20111018_65_65.jpg|IRC 10216 Scan65 18th 1mm map}}|| | ==== FXD, 24 Oct 2011 - Photometric quality ==== Here are the maps obtained on one OTF scan with IRC 10216. Sky noise decorrelation is used. ||{{attachment:Map2Radec2_A_IRC10216_20111018_65_65.jpg|IRC 10216 Scan65 18th 2mm map|width=400}}||{{attachment:Map2Radec2_B_IRC10216_20111018_65_65.jpg|IRC 10216 Scan65 18th 1mm map|width=400}}|| The flux per kid is shown here using the calibration on Mars Scan #55. This is an indication that the new camera with its dIdQ modulation scheme provides a big photometric improvement with respect to 2010 campaign. The average flux is compatible with the range of fluxes measured on this (variable) source. {{attachment:Flux_PerKid_IRC10216_20111018_65_65.jpg|IRC 10216 Scan65 18th Flux per kid|width=400}} ==== RZ, 25 Nov 2011 - Pointing & focus effects ==== To derive the source positions I used the pointing maps available in the IRAM Multi Beam FITS (IMBFits) format. However, currently over 20% of the pointing are missing. The statistics shown below is therefore represantative but by far not complete. {{attachment:gfPoiEq.png}} Source positions in the eq offsets. Positions of planets are not shown. In red are shown positions of sources used for the pointing model, in black after the installation of the pointing model. The pointing run was apparently performed with Nasmyth offsets of EMIR ! The pointing offsets after the installation of the pointing model are still very large, even 3-5 times larger than the normal values. {{attachment:gfPoiHor.png}} As above in the hor system; positions of planets are also shown. {{attachment:MarsUranus_azOff_extCorr.png}} {{attachment:MarsUranus_elOff_extCorr.png}} Effekt of defocusing: the source moves by a couple of arcsec in azim & elev. Note the larger scatter of the elev-positions. Both, the pointings and foci were done by mapping. However, to correctly process maps the correct beam parameters, i.e. the pixel positions and their flat field are mandatory. The effective FoV geometry, the flat field and their errors will come next. ==== SL, 07 Nov 2011 - Expected field distortion ==== [[attachment:NIKAv2_Grid_distortion.pdf | grid distortion ]] ==== FXD, 21 Nov 2011 - Technical note on kid frequencies ==== ''FXD, 24 Nov 2011 updated v2 (Fits format exchange)'' [[attachment:NIKA2011_TechNote1_v2.pdf | Kid frequencies, fits format]] ==== AM,MC 24 Nov 2011 Spectral transmissions ==== {{attachment:Spectra-single pixel.jpg| (IN/LPSC) Martin-Pupplet Interferometer Spectral Bandpass transmission}} ==== SL, 30 Nov 2011 - Calibration sources with PdB flux references ==== [[attachment:Calibration_sources_NIKA2011_and_PdB.xls | calibrators fluxes ]] ==== MC 24 Nov 2011 RF calculation on Mars ==== {{attachment:fit_IQ.jpg| RF calculation strategies | width=800}} Blue line is the RFdIdQ as calculated in the standard way. Red, green and black are the results obtained using a 2-d polinomial fit of grade 2, 3 and 4 respectively. ==== MC 24 Nov 2011 dIdQ modulation on strong sources ==== {{attachment:strong_source.jpg| dIdQ of modulation versus dIdQ of signal | width=800}} The blue line is the trajectory on the IQ plane when observing mars (approx 7kHz signal). The red line is the observed DeltaI, DeltaQ, averaged on 100 points (please do not consider it. It doesn't have a lot of sense. I'll update.). Interesting are the green arrows, whiwh are the dI dQ obtained by the LO modulation: near the peak of the source, where we get far from the resonances, they get farther from the tangent of the IQ trajectory... to be investigated! ==== RZ, 30 Nov 2011 - Beam maps ==== {{attachment:beam_map_1mm_Mars.jpg}} {{attachment:beam_map_1mm_Neptune.jpg}} {{attachment:beam_map_scater_position.jpg}} |
NIKA3 Offline Processing Results
2011 October run
=Private results for the collaboration only=
Public results
List of offline processing tasks
FXD, 24 Oct 2011 - Photometric quality
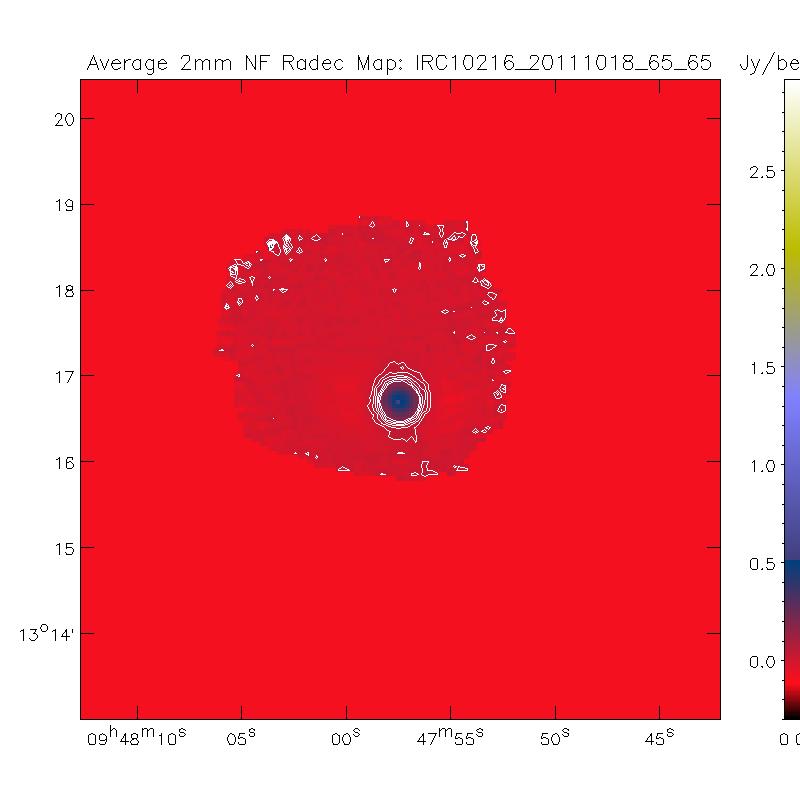
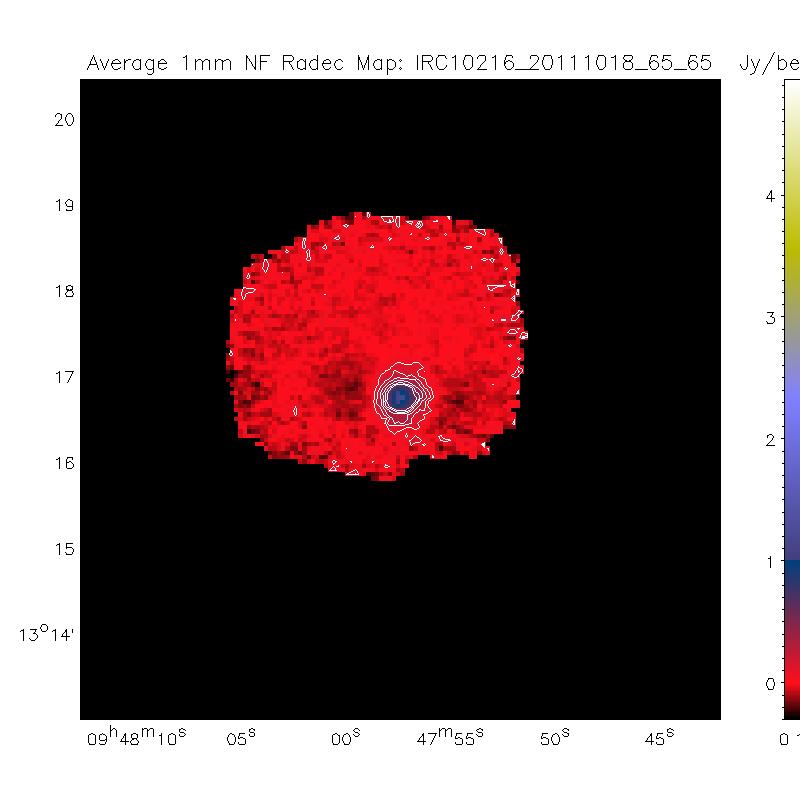
Here are the maps obtained on one OTF scan with IRC 10216. Sky noise decorrelation is used.
|
|
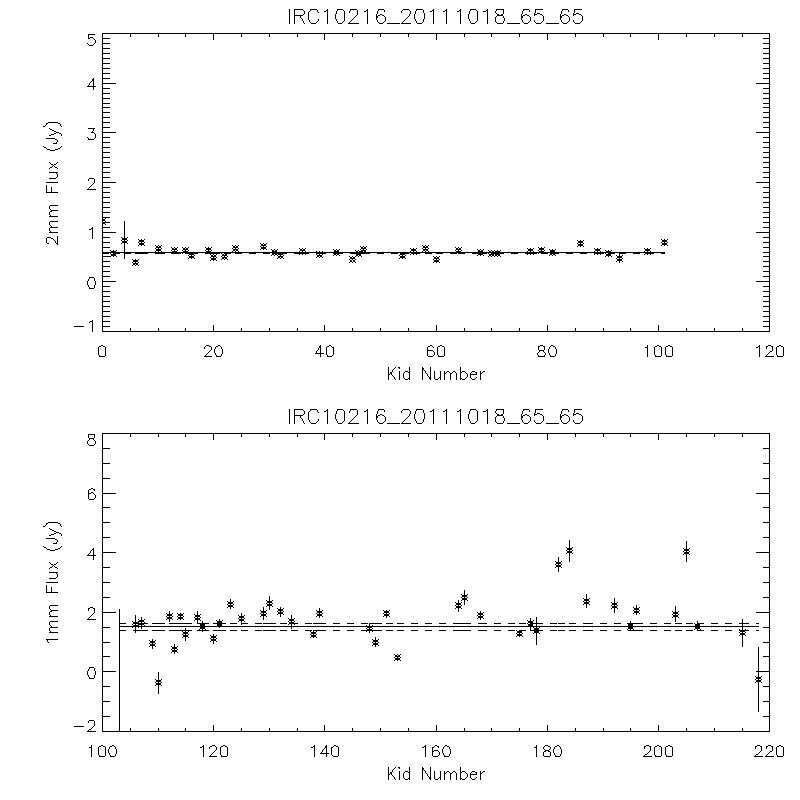
The flux per kid is shown here using the calibration on Mars Scan #55. This is an indication that the new camera with its dIdQ modulation scheme provides a big photometric improvement with respect to 2010 campaign. The average flux is compatible with the range of fluxes measured on this (variable) source.
RZ, 25 Nov 2011 - Pointing & focus effects
To derive the source positions I used the pointing maps available in the IRAM Multi Beam FITS (IMBFits) format. However, currently over 20% of the pointing are missing. The statistics shown below is therefore represantative but by far not complete.
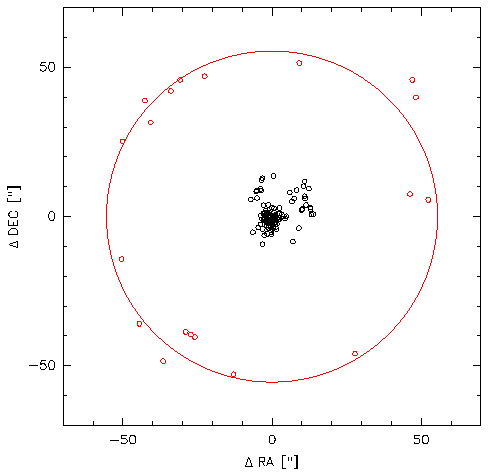
Source positions in the eq offsets. Positions of planets are not shown. In red are shown positions of sources used for the pointing model, in black after the installation of the pointing model. The pointing run was apparently performed with Nasmyth offsets of EMIR ! The pointing offsets after the installation of the pointing model are still very large, even 3-5 times larger than the normal values.
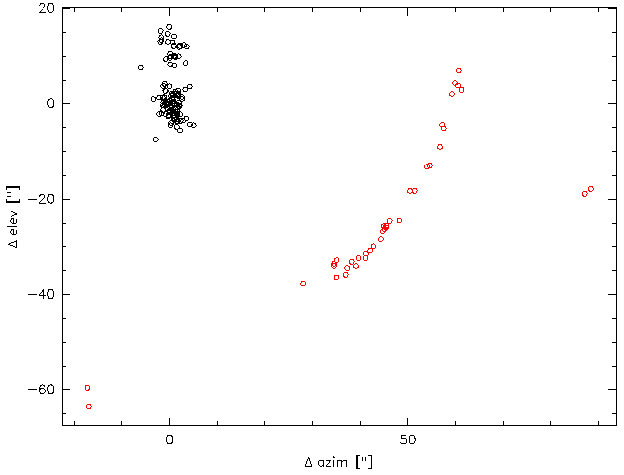
As above in the hor system; positions of planets are also shown.
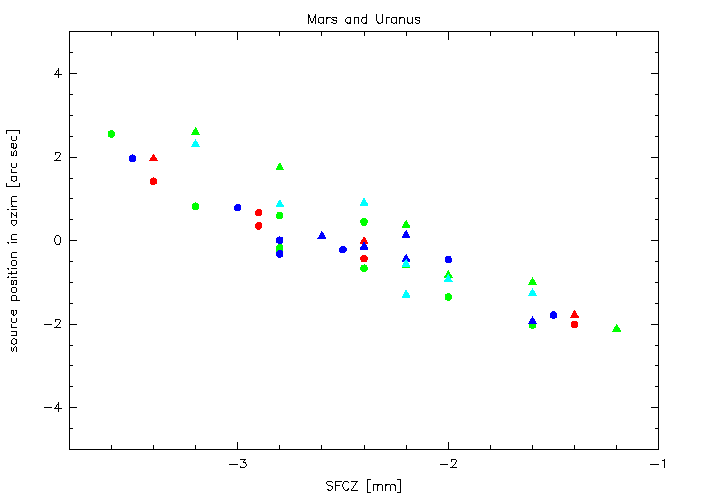
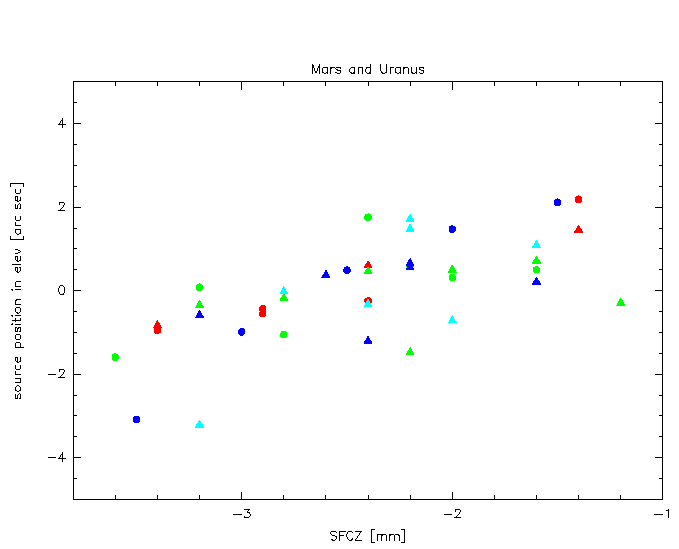
Effekt of defocusing: the source moves by a couple of arcsec in azim & elev. Note the larger scatter of the elev-positions.
Both, the pointings and foci were done by mapping. However, to correctly process maps the correct beam parameters, i.e. the pixel positions and their flat field are mandatory. The effective FoV geometry, the flat field and their errors will come next.
SL, 07 Nov 2011 - Expected field distortion
FXD, 21 Nov 2011 - Technical note on kid frequencies
FXD, 24 Nov 2011 updated v2 (Fits format exchange)
AM,MC 24 Nov 2011 Spectral transmissions
![]()
SL, 30 Nov 2011 - Calibration sources with PdB flux references
MC 24 Nov 2011 RF calculation on Mars
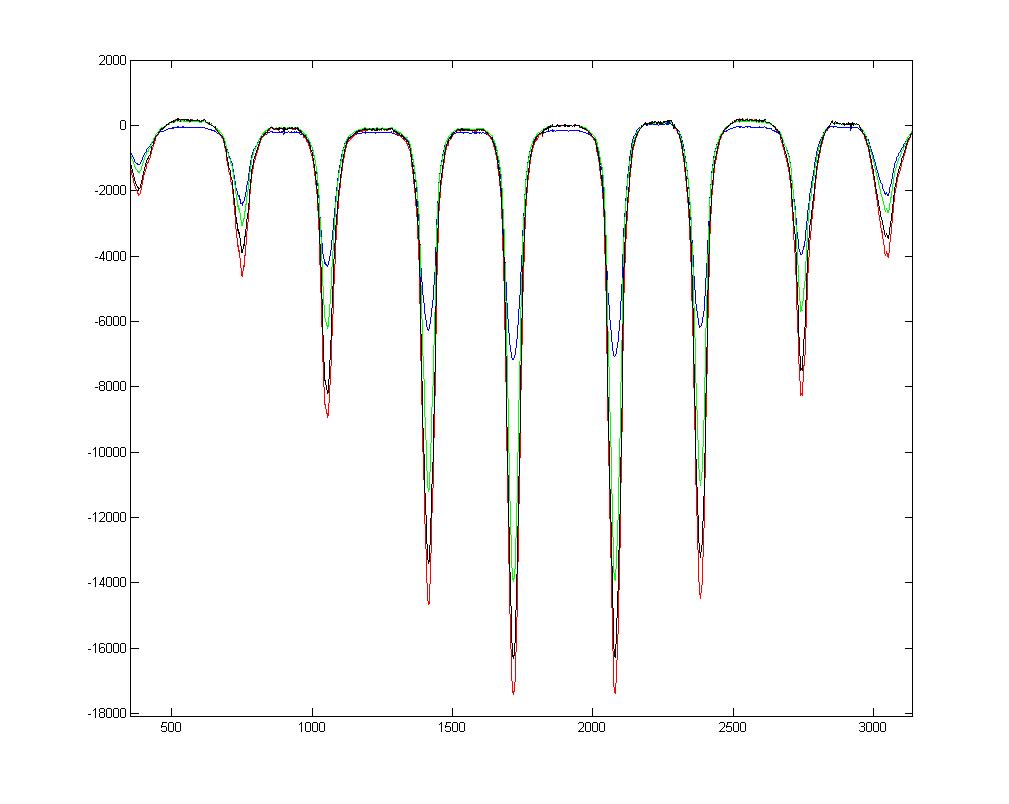
Blue line is the RFdIdQ as calculated in the standard way. Red, green and black are the results obtained using a 2-d polinomial fit of grade 2, 3 and 4 respectively.
MC 24 Nov 2011 dIdQ modulation on strong sources
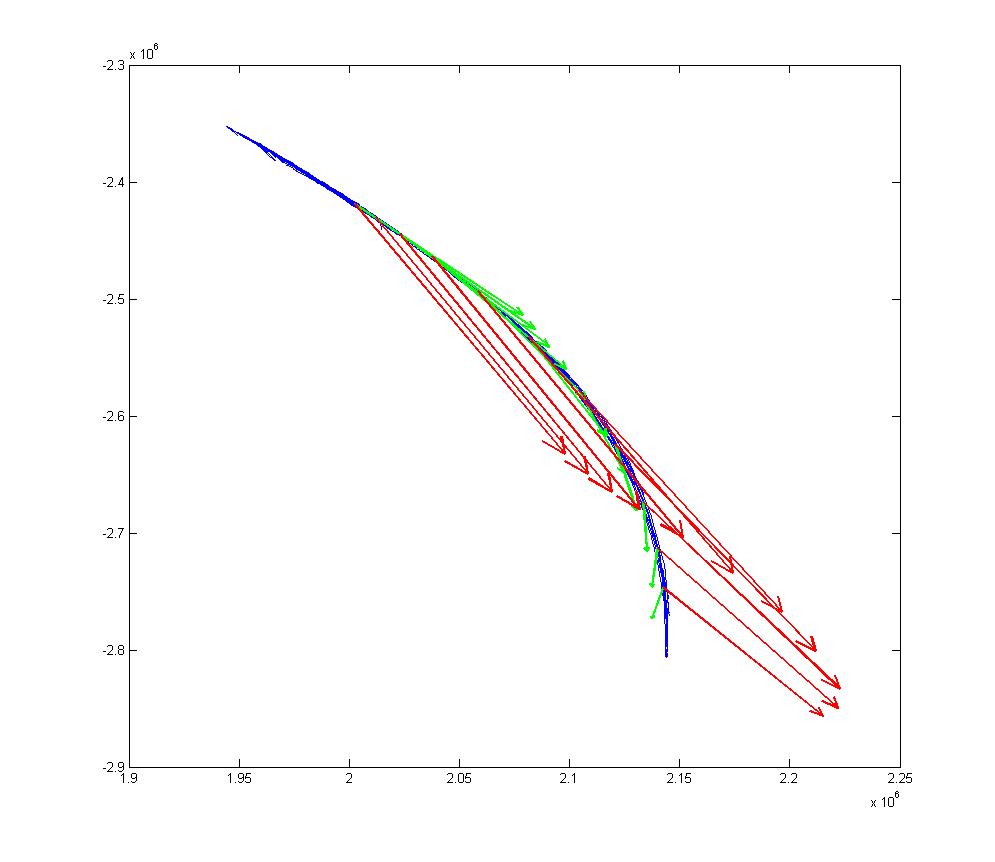
The blue line is the trajectory on the IQ plane when observing mars (approx 7kHz signal). The red line is the observed DeltaI, DeltaQ, averaged on 100 points (please do not consider it. It doesn't have a lot of sense. I'll update.). Interesting are the green arrows, whiwh are the dI dQ obtained by the LO modulation: near the peak of the source, where we get far from the resonances, they get farther from the tangent of the IQ trajectory... to be investigated!
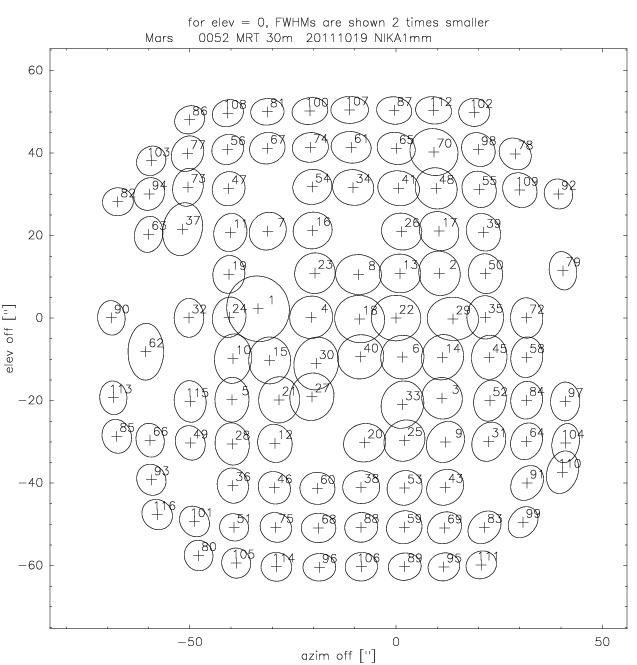
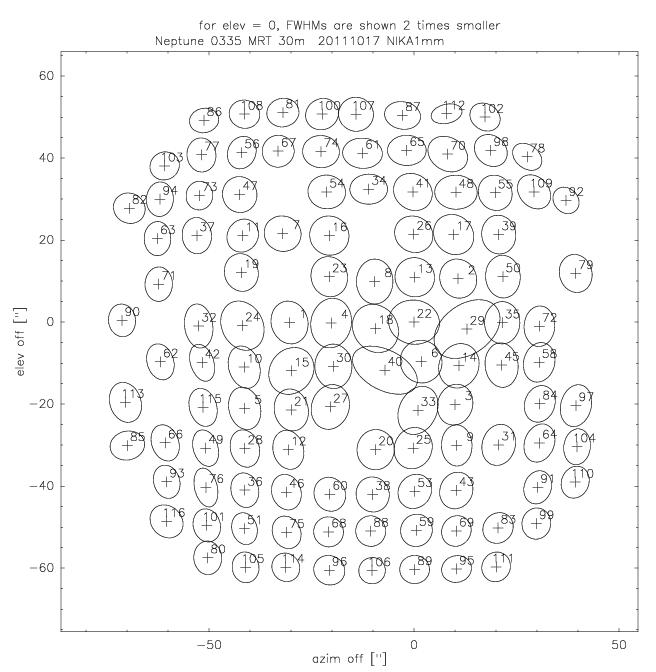
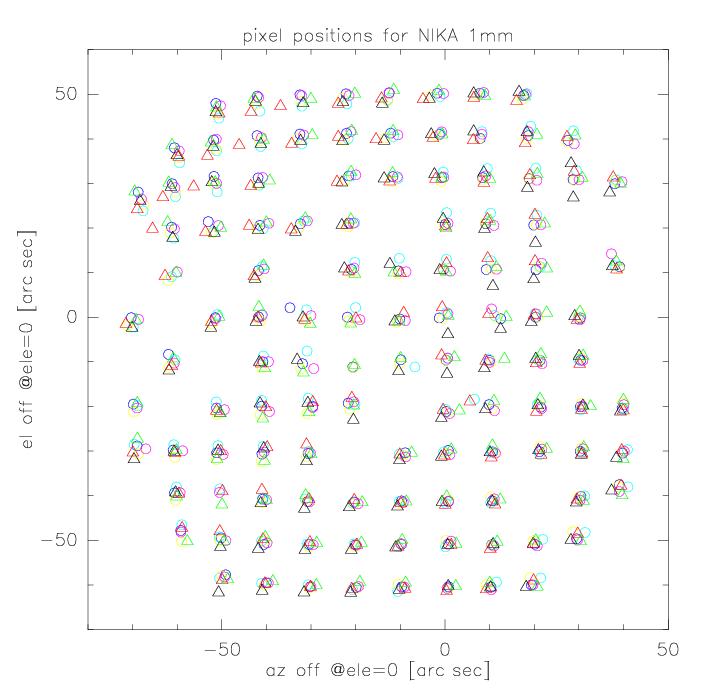
RZ, 30 Nov 2011 - Beam maps
