|
Size: 11819
Comment:
|
Size: 12178
Comment:
|
| Deletions are marked like this. | Additions are marked like this. |
| Line 114: | Line 114: |
| It seems to me that one important problem was not taken into account while analysing the beams: the incorrect coordinates during roughly 2 sec at beginning of each subscan (see e.g. daily reports, Oct 29-30 and my other reports during the past runs). | It seems to me that one important problem was not taken into account while analysing the beams: the incorrect coordinates during roughly 2 sec at beginning of each subscan (see e.g. daily reports, Oct 29-30 and my other reports during the past runs). More recent examples on 3C84 are shown below. |
| Line 119: | Line 119: |
| Though this scan was not used for the beam analysis the shown examples (i.e. 20151029s95 & 96, 20151106s17) are representative for for all OTF observations. | |
| Line 151: | Line 152: |
| To improve the overall beam efficiency for all pixels, we could add an offset to the measured best focus value of the central pixels. (CK 10-Nov) | To improve the overall beam efficiency for all pixels, we could add a constant offset to each focus, i.e. to the measured best focus value of the central pixels at a given time. This constant offsets could come from the optical simulations and the predicted variation of the Strehl ratio. (CK 10-Nov) |
Discussion on NIKA-2 beams
Page created by FXD, CK
Last updated by SL 2015-11-02, JFL 2015-11-07
Contents
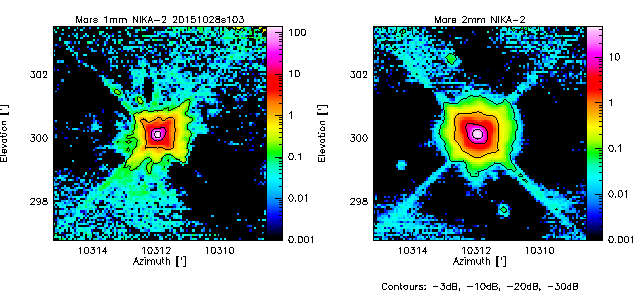
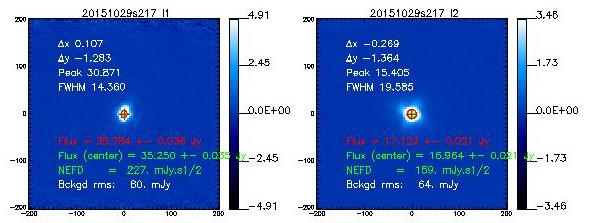
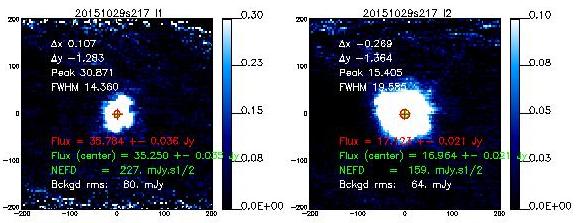
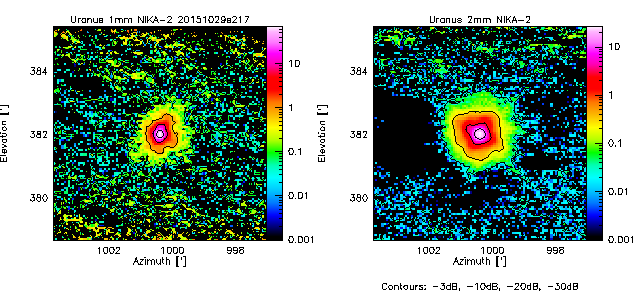
If not said otherwise, we measure the beam by using the middle scan of the 3-scans sequence launched with @beammap . These are 20'x20' maps done on-the-fly with 55"/sec scanning speed. Here, we show the best-of on 3 sources.
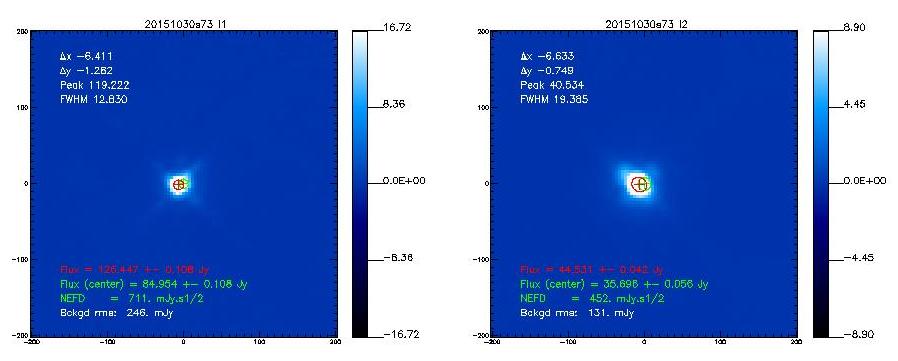
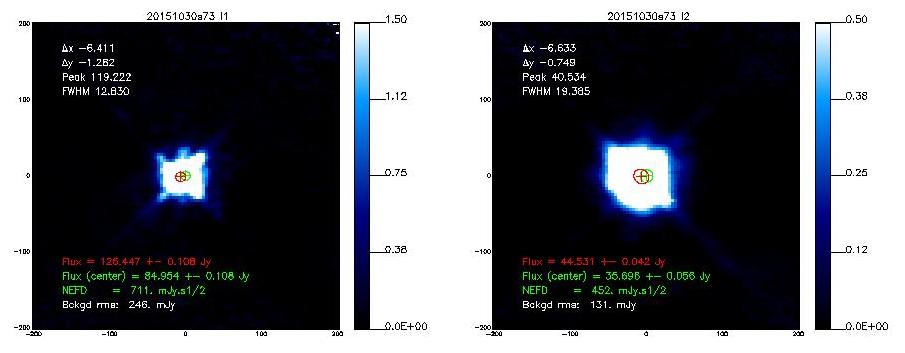
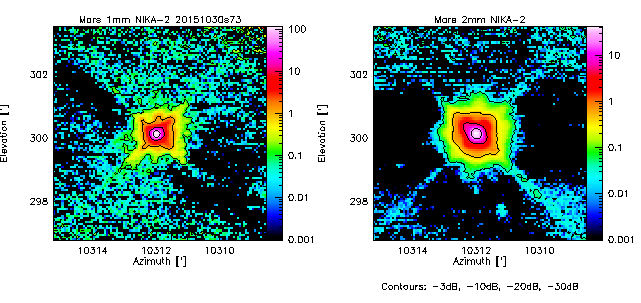
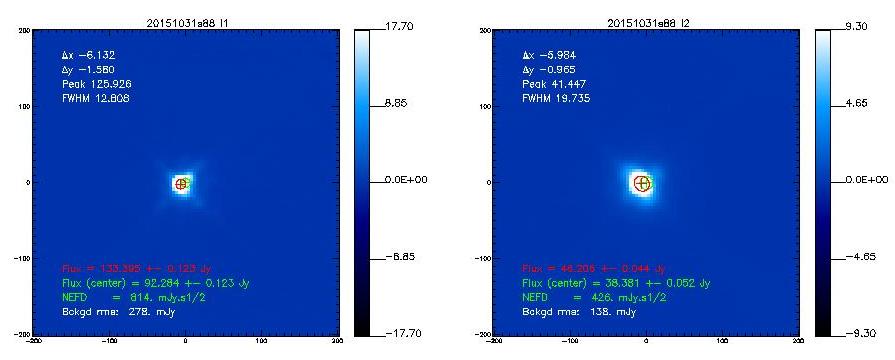
Beam maps on Mars
- 20151030s73
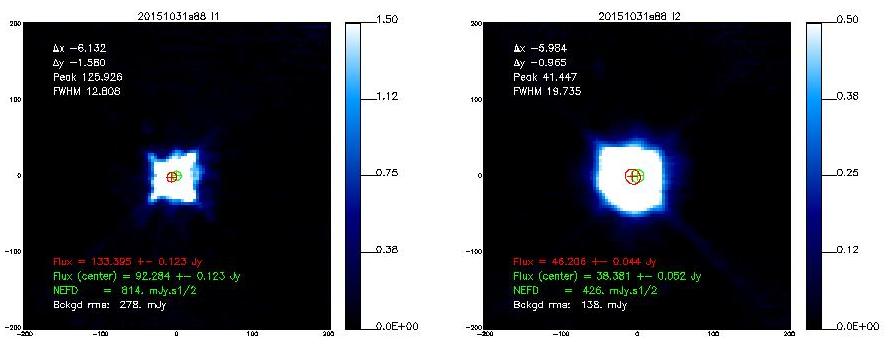
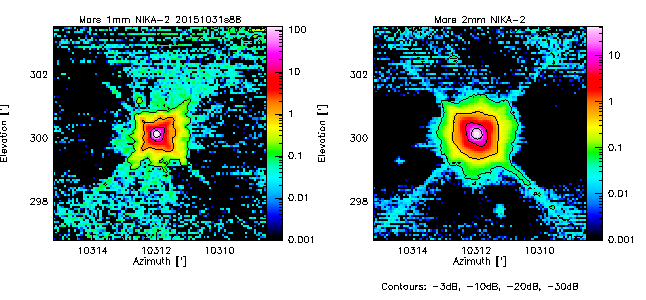
- 20151031s88
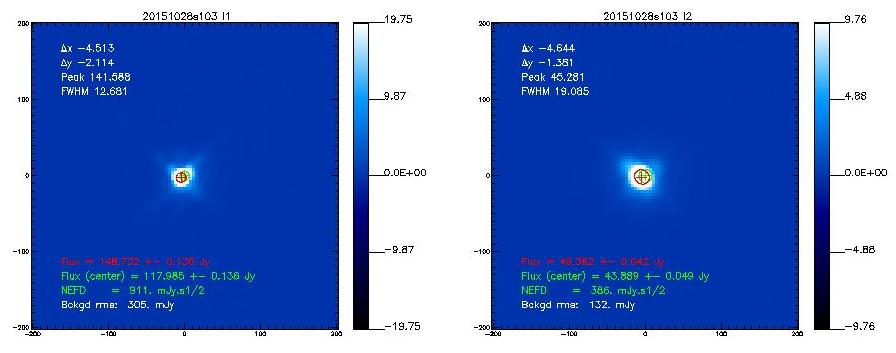
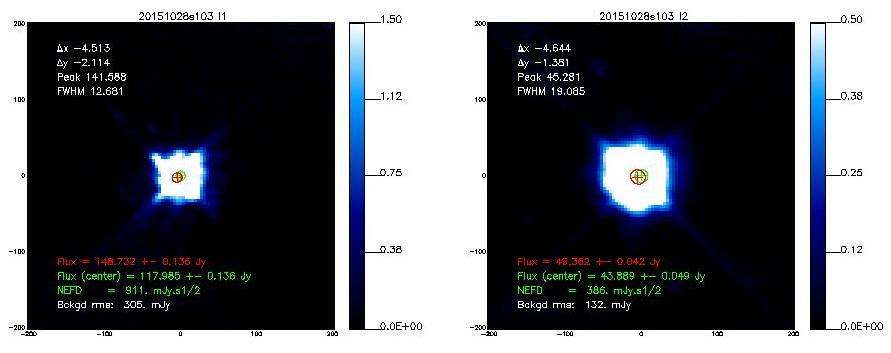
- 20151028s103
Beam maps on Uranus
- 20151029s217
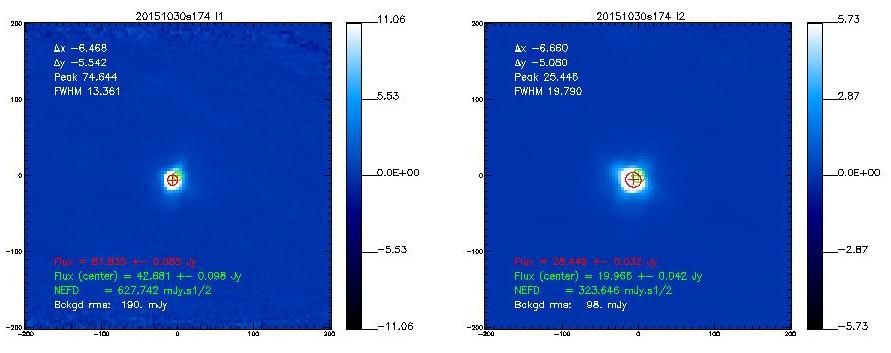
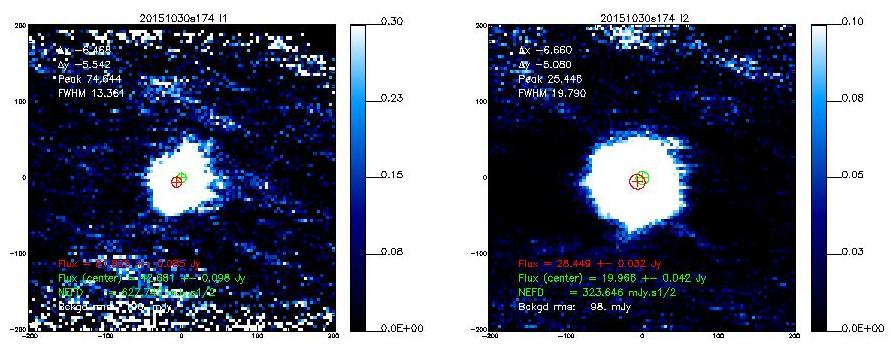
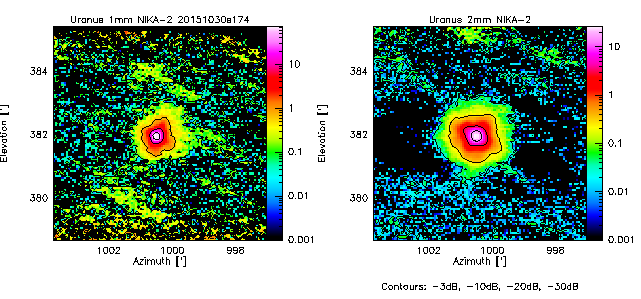
- 20151030s174
Maps on 3C84
Beam maps
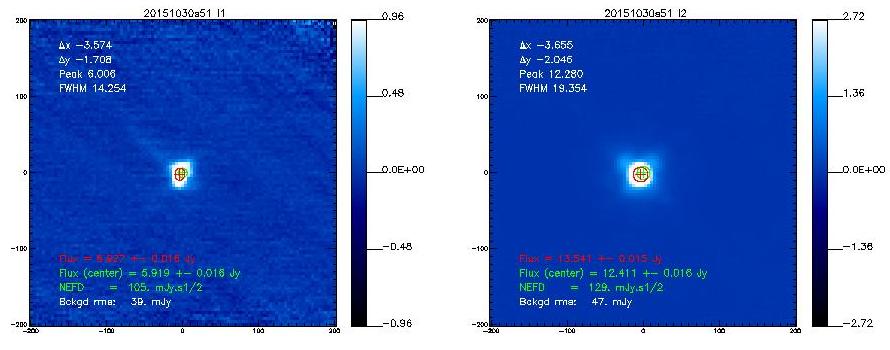
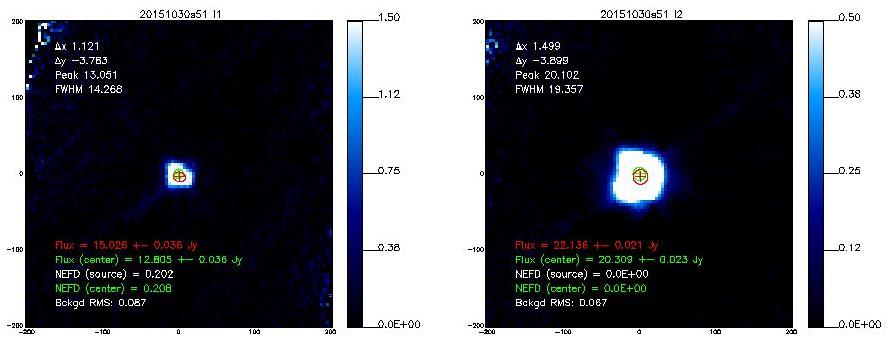
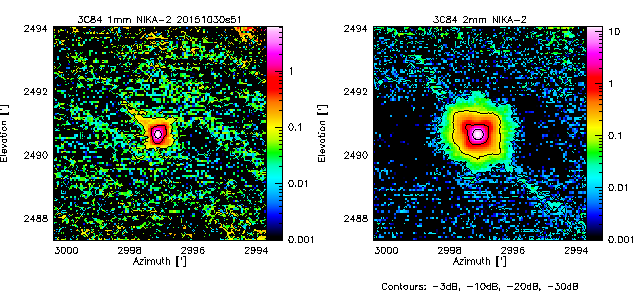
- 20151030s51
Series of small maps on 3C84 by JFL under poor conditions
- A short report on NIKA2 beamwidth using repeated observations of 3C84 at elevations between 52 and 73 deg in poor weather condition (tau_225 ~ 0.7).
Means and rms with 30 SMALL (5'x5' : nkotf 5 5 0/90/135/45 0 30 60 AZEL) on 3C84 (scans 20151104s21, s22, s23, scans 20151105s13, s14, s15, s16, s17, s19,
scans 20151106s15, 18, 22, 23, 24, 25, 26, 27, 28, 29, 30, 32, 33, 34, 35, 36, 37, 38, 39, 40, 41
array
FWHM
uncert
1
12.03"
+/-0.48"
2
19.37"
+/-0.81"
3
11.84"
+/-0.68"
Means and rms with 3 LARGE otf (20'x20', nkotf 20 20 0/90/135/45 0 30 60 AZEL) on 3C84 (scans 20151105s18, s20, s21)
array
FWHM
uncert
1
13.18"
+/-0.83"
2
19.71"
+/-1.20"
3
12.97"
+/-0.37"
Means and rms with 4 small, low velocity otf (5'x5', nkotf 5 5 0/90/135/45 0 15 30 AZEL) on 3C84 (scans 20151107s35, s37, s39, s41)
array
FWHM
uncert
1
11.57"
+/-0.26"
2
19.05"
+/-0.34"
3
11.47"
+/-0.14"
Preliminary findings
- The main beam (the Gaussian part) seems with a normal width aka 11", 17" (but only in single-pixel analysis). Blind 2D Gaussian fits to the maps result in broader beams of 13", 19.5" (see Table below).
- The quadrupod holding the secondary gives clear diffraction marks as a faint cross at about -30dB, visible in all Mars scans. Uranus and 3C83 are not bright enough to reach -30dB. To go deeper, we need Saturn or Jupiter maps.
- In between, there is a large near-side lobe, especially at 2mm (but also visible at 1mm), that shows up as a rectangular pyramid-like shape at the 10% level, the origin of which is unknown. It seems to scale with wavelength. It was not so apparent in NIKA. Therefore the quality of the dichroic is not at the center of this issue.
In fact the rectangular shape of the first side lobe is known and expected from optical simulations (I didn't communicate about it until now). It is due to the combined diffraction on the primary mirror and the tetrapod holding the secondary mirror. However, the expected level of this side lobe is ~2% of the central peak when the focus is correct, and it increases to 10% if the defocus along the Z axis of M2 is ~0.7 mm. See the figure at the bottom of this page for more details. -SL-
For comparison, see the NIKA-1 beam maps in Fig.8 of Catalano+2014 and in Fig.8 of Monfardini+2011.
- The following table shows the FWHMs derived from 2D-Gaussian fits to the observed emission.[Note that if the error beam is included in the fit, the main beam narrows down]
Source
Date/Scan
HPBW
HPBW
1mm
2mm
Mars
20151030s73
12.9
19.3
Mars
20151031s88
12.7
19.6
Uranus
20151029s217
14.5
19.5
Uranus
20151030s174
13.2
19.7
3C84
20151030s51
14.3
19.4
- Will redo the greg plots of the beams, together with 2D Gaussian fits, and create radial averages, once the coordinate problems in the IDL fits data have been solved. This is actually on the way. (CK 4-Nov-2015)
Maps seem too small ! Comment by RZ
It seems to me that one important problem was not taken into account while analysing the beams: the incorrect coordinates during roughly 2 sec at beginning of each subscan (see e.g. daily reports, Oct 29-30 and my other reports during the past runs). More recent examples on 3C84 are shown below.
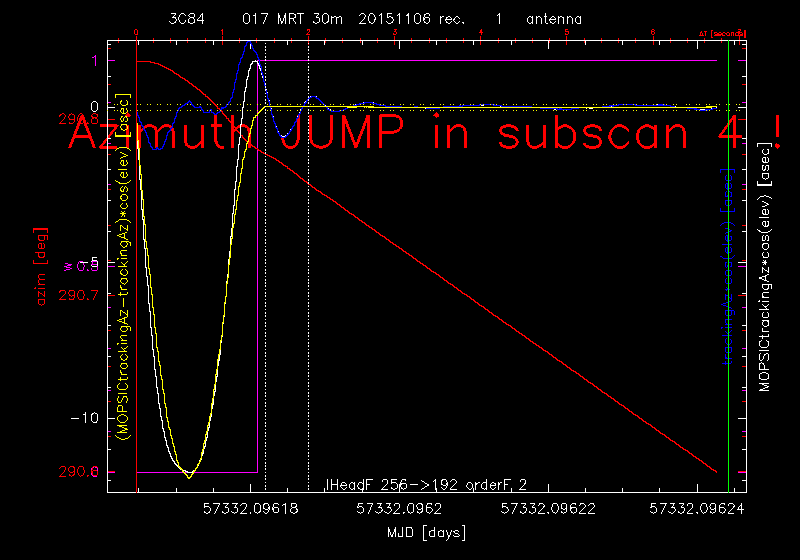
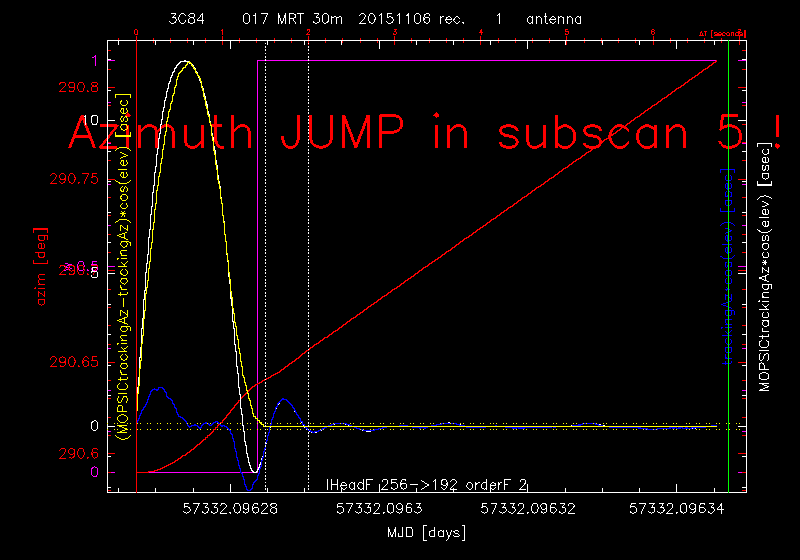
In blue are shown the available tracking errors, in white the correct values. How large is the error of the coordinates depends on the elevation and the scanning speed. For usable obs. parameters the values may reach even 30arcsec ! Though this scan was not used for the beam analysis the shown examples (i.e. 20151029s95 & 96, 20151106s17) are representative for for all OTF observations.
In such a case the general condition for map size in the scanning direction in case of not perfectly stable receiver:
mapSize = sizeOfSource + sizeOfFOV + base
must be changed to:
mapSize = sizeOfSource + sizeOfFOV + base + 2*sizeOfErrorZone
sizeOfSource is the diameter of the to be analysed error beam (read from the attached figures 1 to 2arcmin), sizeOfFOV is 6.5arcmin, base should be at least 3*HPBW, sizeOfErrorZone is ~2sec*scanning velocity, i.e. ~2arcmin.
This shows that only the 20arcmin maps satisfy the above condition. For smaller maps the pixels which appear at map edges must be excluded from the analysis. As the array rotates with elev in (azim,elev) different pixels are affected. (RZ, 6-Nov-2015)
Theoretical beams from Zemax simulations (for comparison, SL 2015-11-02 and 04)
By design of the optics the image plane is as flat and aberration-less as possible, but for such a big FoV and given the constraint on the number of lenses we can't avoid that the optimal focus surface on the image plane has a residual bowl shape, which correspond to 0.4 mm amplitude of M2 along Z between the central pixel and an edge pixel (6.5'diameter ring). But the distance along the M2 Z axis between the best central and the best average is 0.2mm (= best at the 4' diameter ring). As a consequence there's a Strehl ratio (~beam peak amplitude) variation of 10% at 1.2mm and 4% at 2mm along the FoV if the focus is on the central pixel, but these values are reduced to less than 3% at 1.2mm and less than 1% at 2mm if the focus is on the 4' diameter ring.
The images below show the 1mm band beam shape in false color and logarithmic scale, and a cross section in linear scale, for the central pixel (top) and an edge pixel (bottom) for various position of the focus (note the 2mm band beam shape is identical to the 1mm beam, but it is larger and twice less sensitive to the focus variation). For the best central focus and best average focus I also added some plots of the Strehl ratio along the FOV on the X axis of the image plane from 0 to 3.25' radius. As you can see in any case we are still significantly above the diffraction limit; in the worst case of 10% decrease of the Strehl ratio (e.i. focus on the central pixel), we convolve a 0.2 mm radius aberration spot with a 1.7 mm radius Airy pattern for the central pixel and a 0.8 mm radius aberration spot with a 1.7 mm radius Airy pattern for the edge pixel, while the aberration spot variation is at most +/- 0.1 mm on the image plane for the best average focus. Thus, the beams are always acceptable to maintain the angular resolution, but less optimal in terms of contrast on the image (e.i. dynamic, e.i. gain) if we focus on the central pixel versus the best average focus.
Table of the HPBW for the central and an edge pixel, at central focus an best average, based in Zemax simulation (linear plots below) and pixel physical size (illustrate well that the effect of focus inhomogeneity on HPBW is much smaller than on the Strehl ratio, and more importantly much smaller than the variations on real measurements due to other factors):
Central wavelength
1.16 mm
1.92 mm
HPBW central field with focus on central pixel
9.57"
15.41"
HPBW edge field with focus on central pixel
9.86"
15.69"
HPBW central field with best average focus
9.60"
15.42"
HPBW edge field with best average focus
9.75"
15.61"
One question is the size of the main beam (resolution) the other is the efficiency of the main beam (contrast). The main beam efficiency apparently changes quite a lot across the FoV depending on the z focus. This is of course a problem for interpretation of the data (-> astrophysics). Another problem however appears before this, it concerns the data processing: as the SNR of the data increases during the processing by factors even >100 (mainly because the correlated signal (mostly the sky noise) can be filtered out) the change of the main beam efficiency across the FoV sets in general very severe limits for the quality of the processing !
Further, in practice it will not be easy to put the focus to the "best value at the 4' diameter ring" (every measurement has an error, for the focus it is hard to get better than ~0.1mm) and - of course - the focus DOES change with time. The normal situation therefore will be that most pixels will have much larger error beams than in the optimal case. (RZ 9-Nov)
To improve the overall beam efficiency for all pixels, we could add a constant offset to each focus, i.e. to the measured best focus value of the central pixels at a given time. This constant offsets could come from the optical simulations and the predicted variation of the Strehl ratio. (CK 10-Nov)

