NIKA Run#3 Summary of Off line processing Results
The main document is here and refers to figure
3 - Photometry
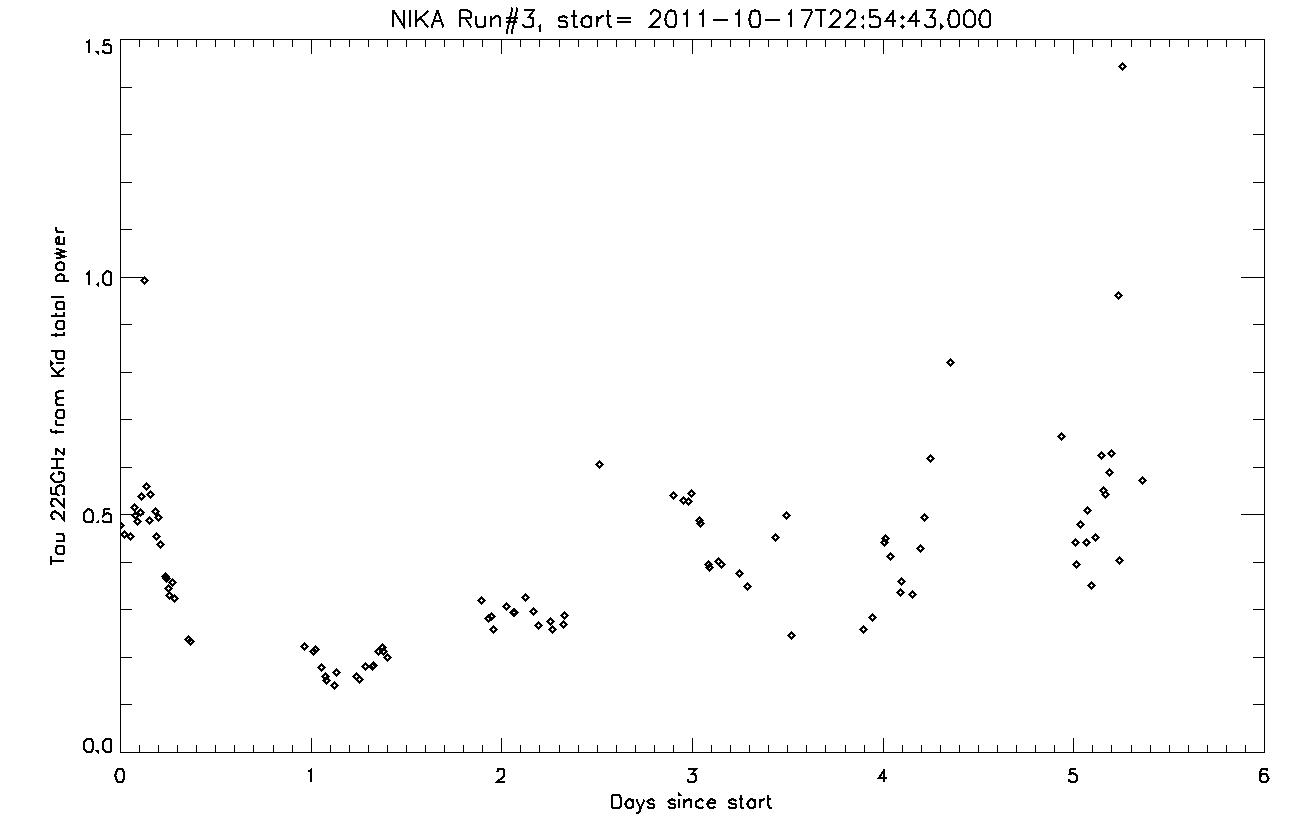
Evolution of the sky opacity during Run#3
Absolute photometry
Using pointing sources (mostly quasars), we compare the absolute flux measured with NIKA run3 with an estimate obtained using PdB measurements. The summary of the photometry is given here as a spreadsheet and in this figure:
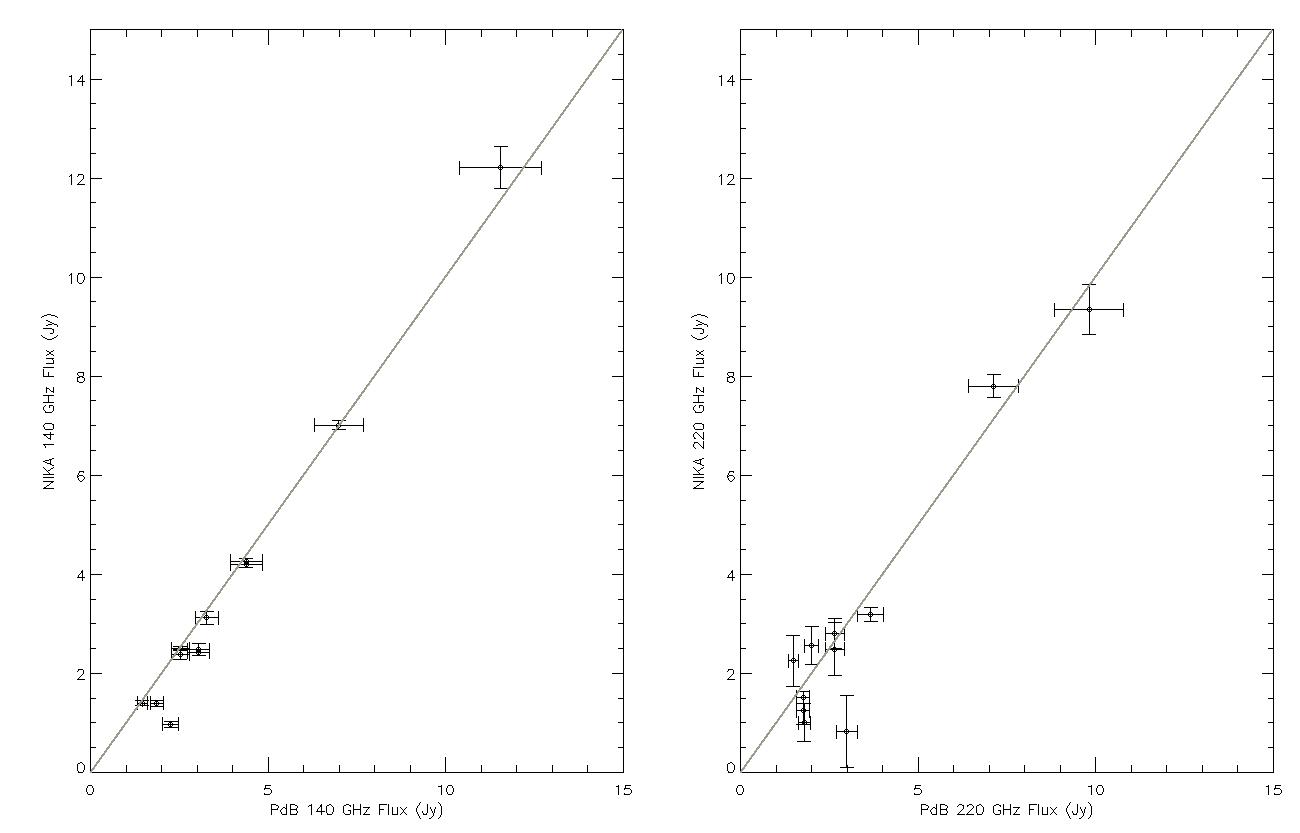
The agreement is reasonable with the fluxes covering from 1.5 to 15 Jy.
The basic data reduction in IDL includes: deglitching, decorrelating from far away pixels and off-resonances, removing of one common mode (the average of the array), calibrating, projecting on the sky, computing a noise map, fixed-width Gauss-fitting (18 and 16 arcsecond FWHM).
In the previous results, these maps and plots were obtained by masking the central point-source so that no filtering shows up in the results.
Here are the results if no masking is used and then a compensating calibration factor 1/(0.615, 0.674) is used: see the spreadsheet, the maps and the plots
Sensitivity
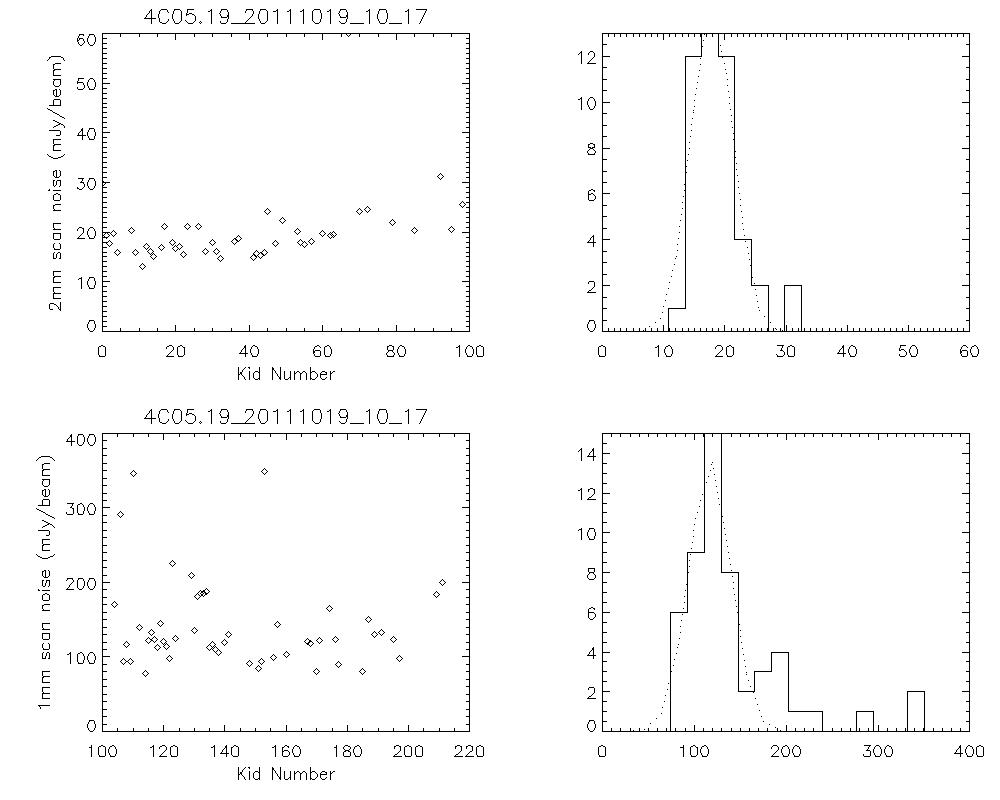
Results for the compact sources of the 20111019 night are shown here. No masking option is used (weak sources). In the case of weak sources and several scans, one can compute the noise from the dispersion of fluxes measured on the average of the map fluxes of different scans (W fluxes in the spreadsheet) or from the dispersion of the flux measurement of each detector map averaged over all scans. These two methods give consistent flux measurements. The error bar is consistent too for weak fluxes only. For stronger sources the photometric uncertainties contribute to the detector-based flux measurement too (source noise).
The 20111019 flux measurements as a spreadsheet and in these figures as: maps and plots
Results for the compact sources of the 20111020 night are here (worse sensitivity but interesting results):
The 20111020 flux measurements (pointing sources) as a spreadsheet and in these figures as: maps and plots
and
The 20111020 flux measurements (weak sources) as a spreadsheet and in these figures as: maps and plots
4 - Focal Plane Geometry and Beams
Both RZ (Mopsic) and NP (IDL, from This pdf) have found a distortion of the focal plane geometry well beyond the expected one.
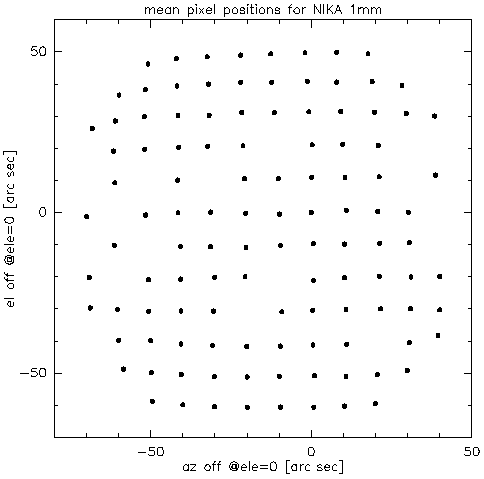
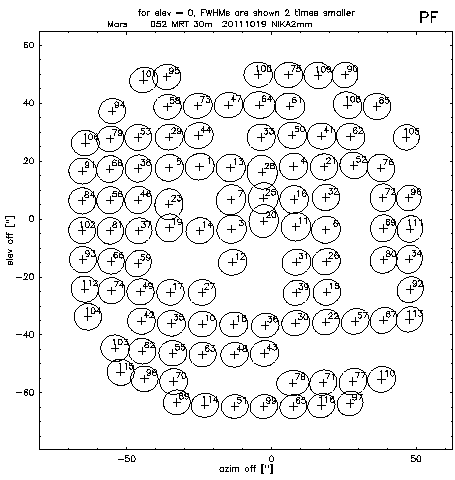
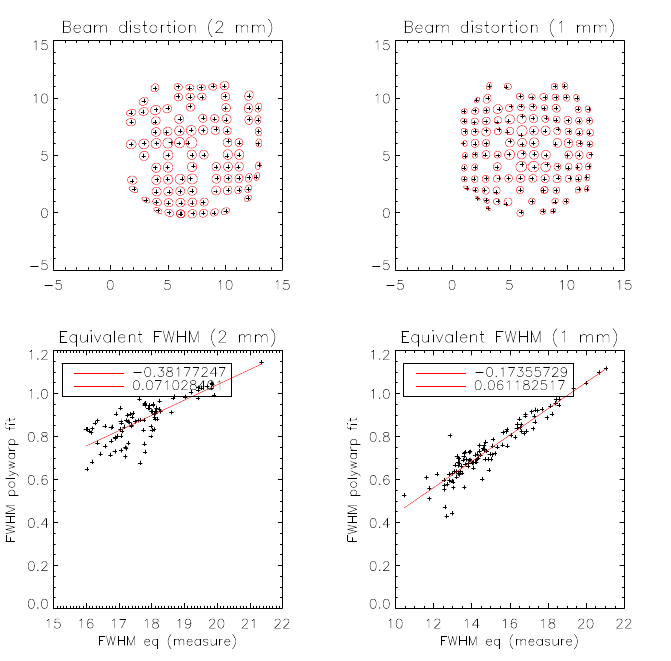
The focal plane distortion affects the beams in a correlated fashion with the Focal Plane Geometry distortion. This points towards a general optical distortion common to both detectors (an optical element is misplaced in the optical train).
5 - Glitches
4 examples of glitches as seen by all detectors, 2 on the A array and 2 on the B array. (Scan 64, A665, 20111020)
Glitch on A, Another glitch on A
Glitch on B, Another glitch on B (quite strong)
6 - Mars plateau
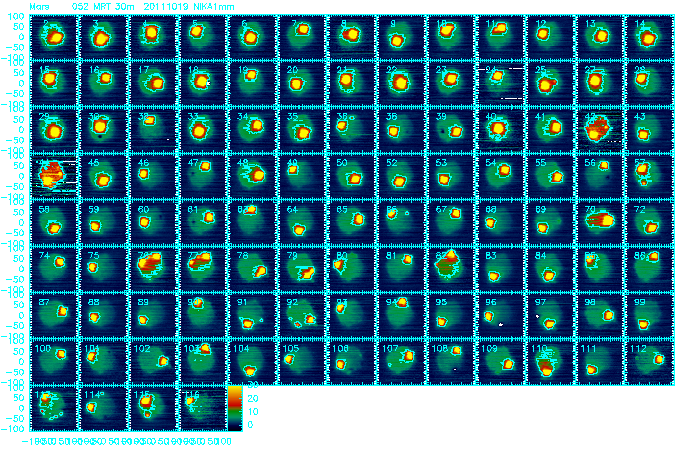
7 Cosmetics
rms of maps per scan per kid per beam, averaged over 5 scans
