Opacity measurement with absolute frequencies of KIDs
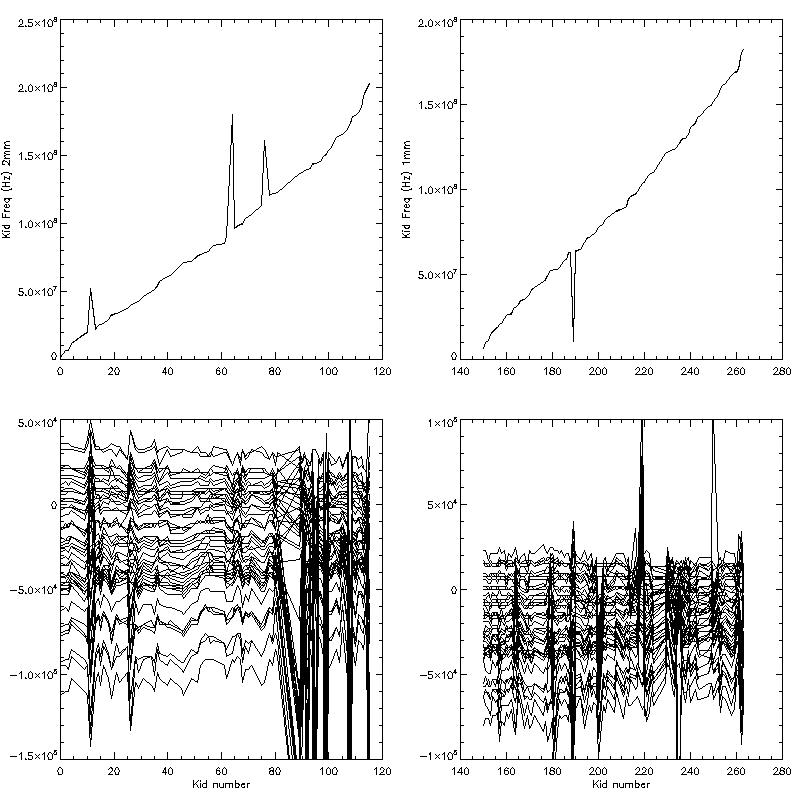
We have used the absolute frequency of the resonance of KIDs as a proxy for the total power on the detector. After each tuning of the kids, each tone should be more or less centered on the kid resonance frequency. This is shown in the following figure for the two channels (2 mm left and 1mm right). In fact all the tunings are superimposed on the top figures because the delta_f is relatively small. On the bottom figures we show the relative frequency with respect to one tuning
 .
.
Beside some outliers, there is a clear trend for KIDs to follow each other in frequency shift. We want to use that as a (linear hopefully) proxy to the total power load on detectors. We use the taumeter at 225 GHz (19th to 23rd of October 2011, on the 18th the taumeter was not working) to calibrate the power.
We define the atmosphere equivalent temperature as the Rayleigh-Jeans expected brightness:
T= Tatm * [1-exp( - Tau225* C * AM) ], [Eq1]
where Tatm is taken as 250 Kelvin, C is the assumed opacity frequency dependence: 1 for the 1mm channel and 0.44 (150/225)^2 for the 2mm channel and AM is the airmass (1/sin(elevation))
For each kid, we find by a linear regression the coefficients (Cal, f0) per kid of the relation between T and the Kid frequency f:
f = - Cal * T + f0 [Eq2]
The minus sign accounts for a decrease in frequency with an increase of power load.
Then, each kid frequency measures the opacity via
Tau= -alog[ 1- (f0-f)/(Cal*Tatm)] / AM [Eq3]
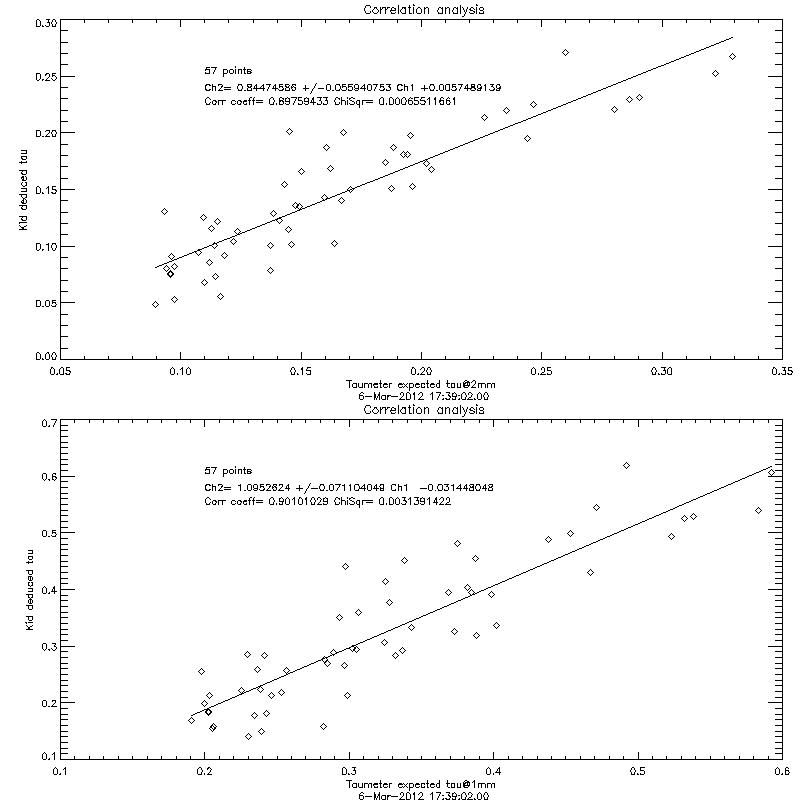
By averaging these values for the normally-behaving kids for channel 1 and 2 separately, we get an accurate value of the opacity as can be seen in this figure:

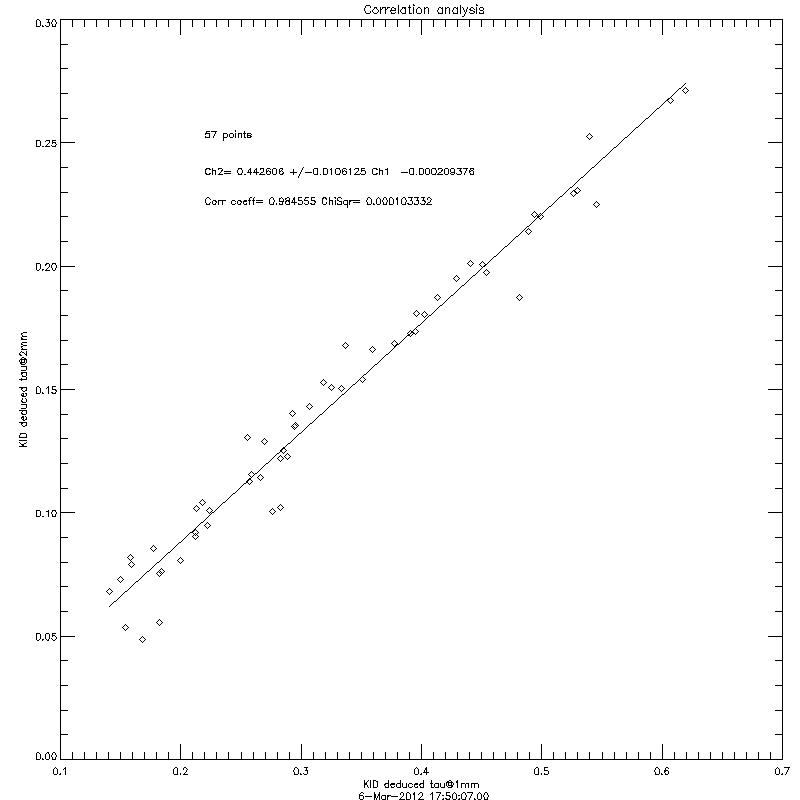
This shows a nice correlation with a slope of one (well, it is built in) but some rather large dispersion (typical rms dispersion of 0.070 ). We think that the KID measurement of opacity is much more accurate than it seems. If we correlate the Taus deduced from the two channels we get

with a dispersion of only 0.011 ! The coefficient is 0.44 which is what we put in.
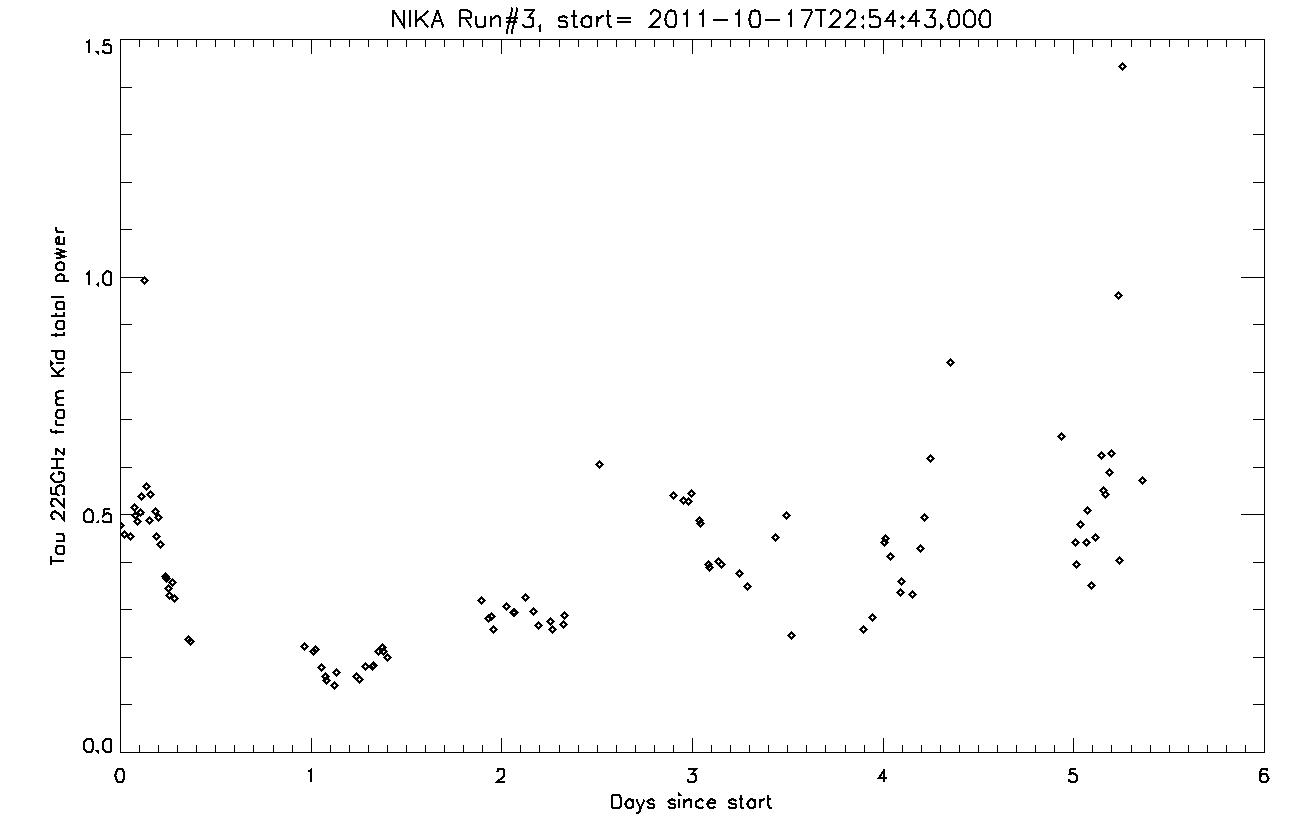
We now have a tool to get the opacity for all scans. Using the calibration parameters given in this file and measuring the absolute frequency of each tone we get an average opacity that can be used to correct flux measurements. The same file contains the opacity as a function of time during the last run. The adopted opacity at zenith at 225 GHz obtained from the kid total power measurements (except for the last day) are shown here:

