|
Size: 1922
Comment:
|
Size: 2110
Comment:
|
| Deletions are marked like this. | Additions are marked like this. |
| Line 28: | Line 28: |
| .The time per pixel maps are also shown | .The time per pixel maps are also shown. It is equivalent to the number of hit map, divided by the sampling frequency. The pixels are 2"x2" here. |
| Line 32: | Line 32: |
| .Combining Jack-Knife maps and time per pixel maps, we are able to estimate the noise level in the data. Note that this is in the case of high opacity (we can expect the noise to be reduced by a factor of about exp(-tau/sin(elevation)) ~ 2, and even more since the resonances are larger under large optical load), and at 1mm it might even be reduced again by a factor of ~2 since we are apparently over calibrated. | .By multiplying the Jack-Knife maps with the squarre root of the time per pixel maps and computing the histogram of the obtained map, we are able to estimate the noise level in the data. Note that this is in the case of high opacity (we can expect the noise to be reduced by a factor of about exp(-tau/sin(elevation)) ~ 2, and even more since the resonances are larger under large optical load), and at 1mm it might even be reduced again by a factor of ~2 since we are apparently over calibrated. |
Brief analysis of the faint source HLS091828 (z=5.243)
Coordinates:
- R.A. = 09h18m28.6s
- Dec. = 51d42'23.3"
Expected luxes (Combes et al. 2012):
- F1.3sma= 55+-7mJy
- F0.88mm= 125+-8mJy
- F2mm= 15+-7mJy
NIKA obsevations:
Day: 13/06/2013
Scans: 9 Lissajous of 5 min (<=> 45 min) each with followed by tracks (for tuning), 180 to 197
Size of the map:90"x90"
Opacity at 225 GHz: 0.7-0.8
Elevation of the source: ~50 deg
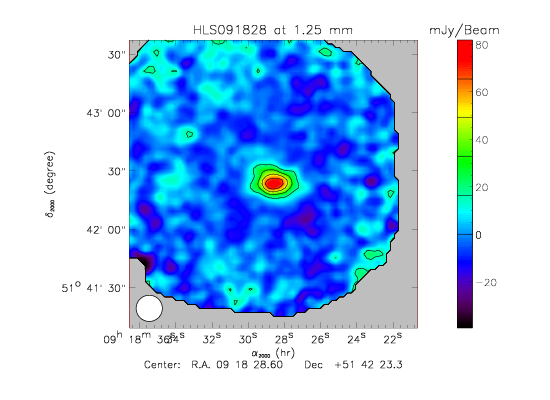
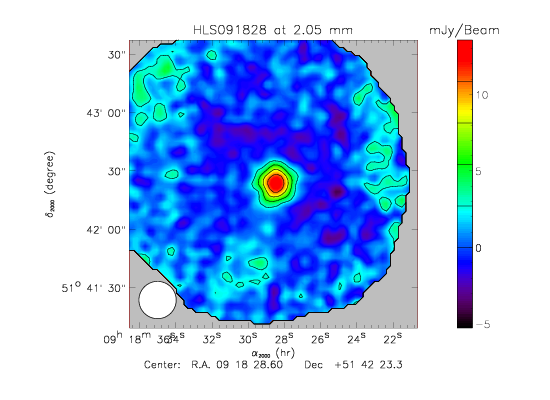
- We detect the source at both wavelenghts, shown on the maps given bellow.
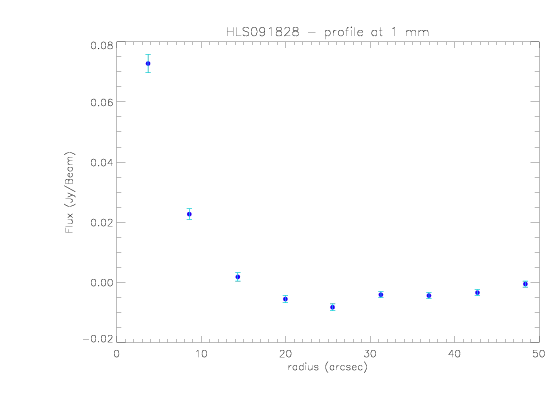
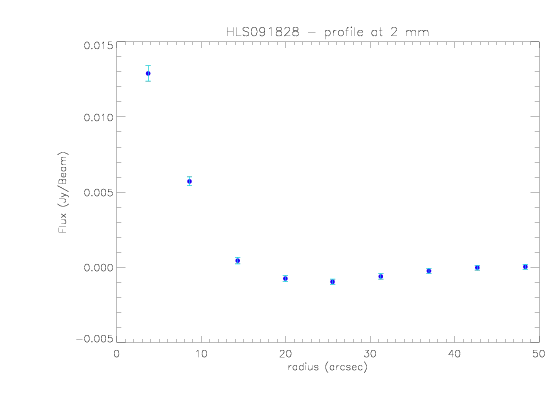
- The profiles are computed by averaging the map in concentric annuli, and we check that the measured flux is, a priori, consistent with what we expect at 2mm but too high at 1mm.
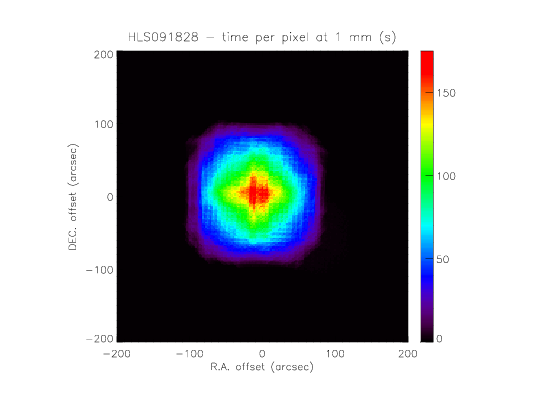
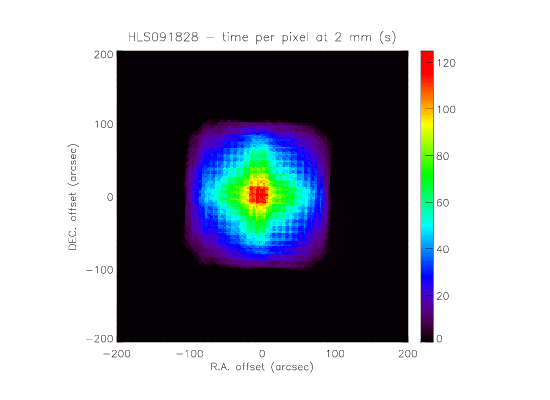
- The time per pixel maps are also shown. It is equivalent to the number of hit map, divided by the sampling frequency. The pixels are 2"x2" here.
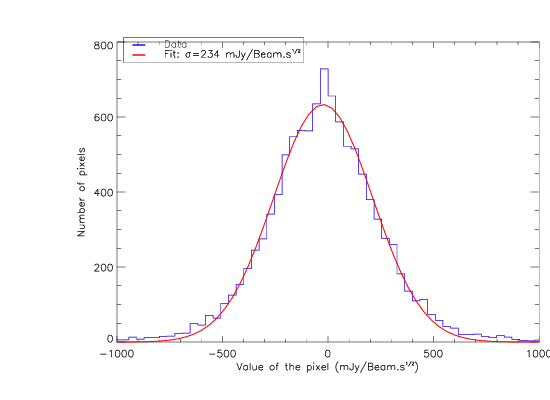
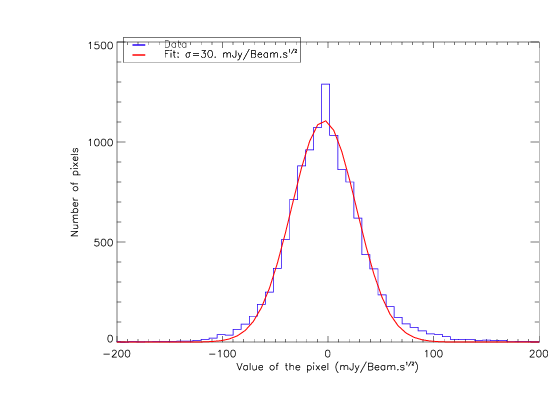
- By multiplying the Jack-Knife maps with the squarre root of the time per pixel maps and computing the histogram of the obtained map, we are able to estimate the noise level in the data. Note that this is in the case of high opacity (we can expect the noise to be reduced by a factor of about exp(-tau/sin(elevation)) ~ 2, and even more since the resonances are larger under large optical load), and at 1mm it might even be reduced again by a factor of ~2 since we are apparently over calibrated.
- If this is correct, the noise is:
~50 mJy/Beam.sqrt(s) at 1mm
~15 mJy/Beam.sqrt(s) at 2mm

