|
Size: 2355
Comment:
|
← Revision 3 as of 2009-04-18 16:35:18 ⇥
Size: 2367
Comment:
|
| Deletions are marked like this. | Additions are marked like this. |
| Line 12: | Line 12: |
| {{attachment:2mmpage1.png}} {{attachment:2mmpage2.png}} {{attachment:2mmpage3.png}} {{attachment:2mmpage4.png}} {{attachment:2mmpage5.png}} {{attachment:2mmpage6.png}} |
{{attachment:2mmpage1-1.png}} {{attachment:2mmpage2-2.png}} {{attachment:2mmpage3-3.png}} {{attachment:2mmpage4-4.png}} {{attachment:2mmpage5-5.png}} {{attachment:2mmpage6-6.png}} |
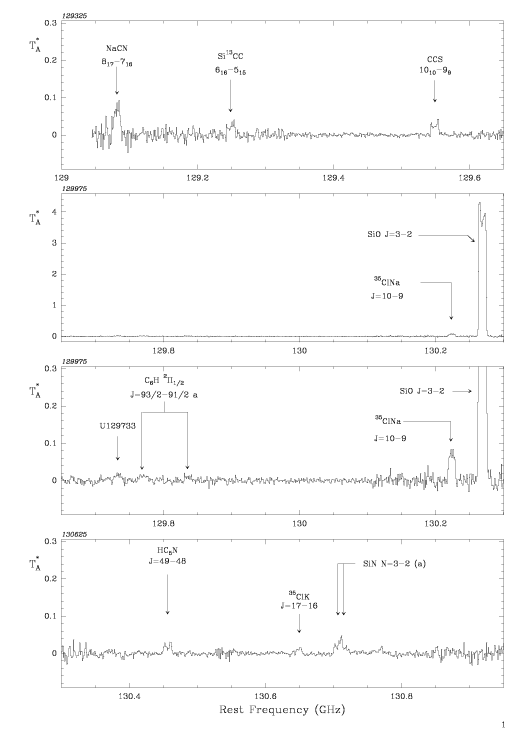
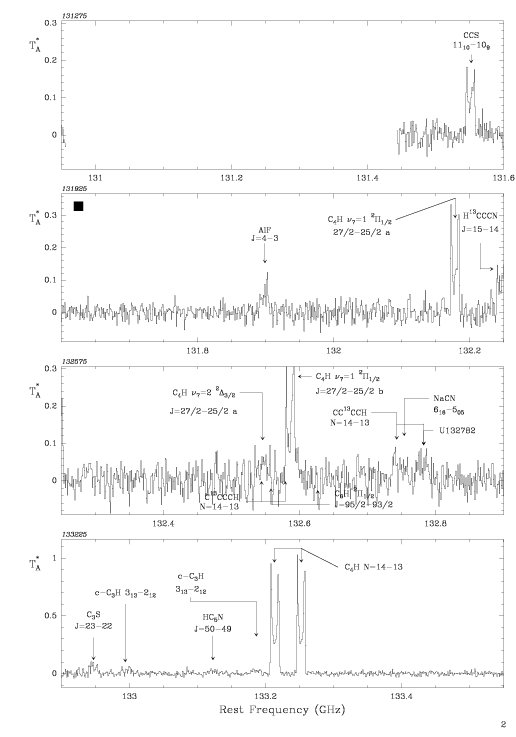
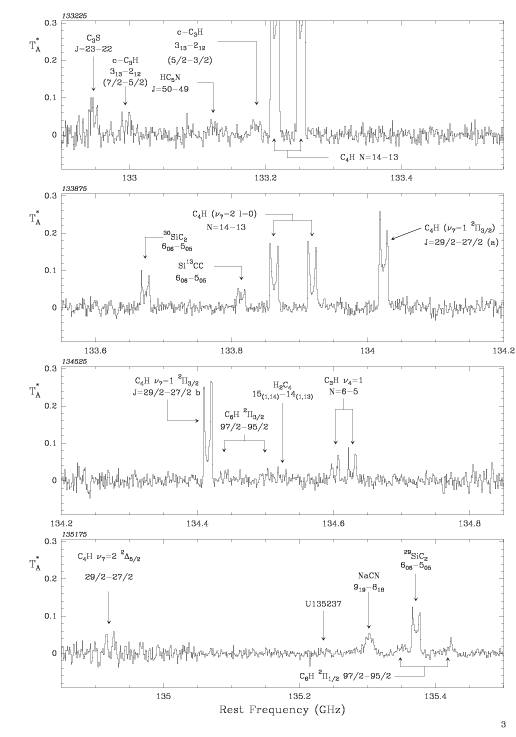
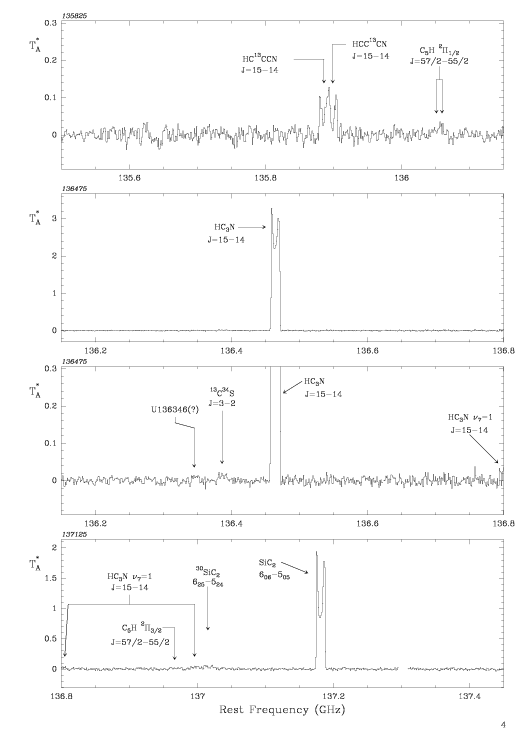
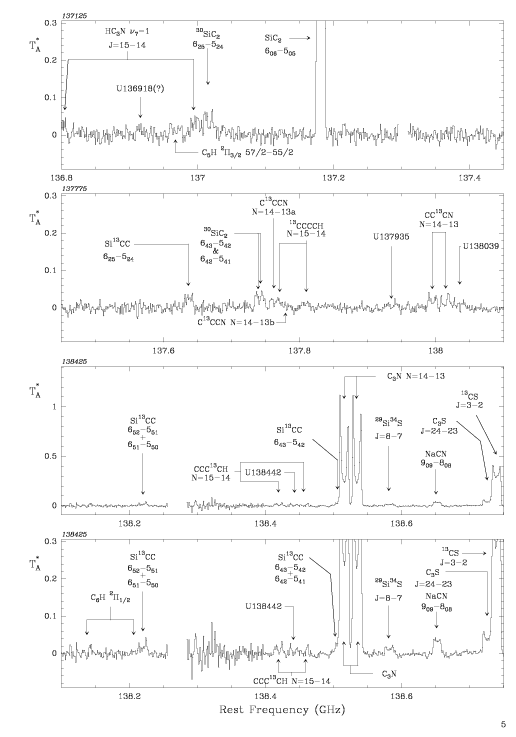
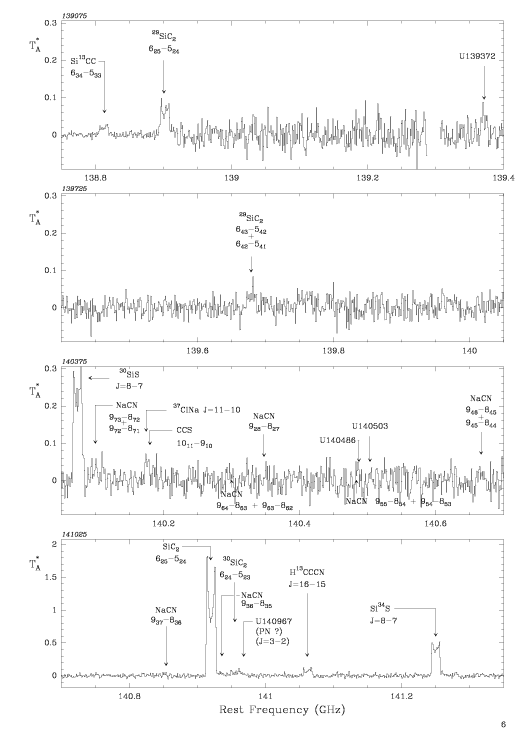
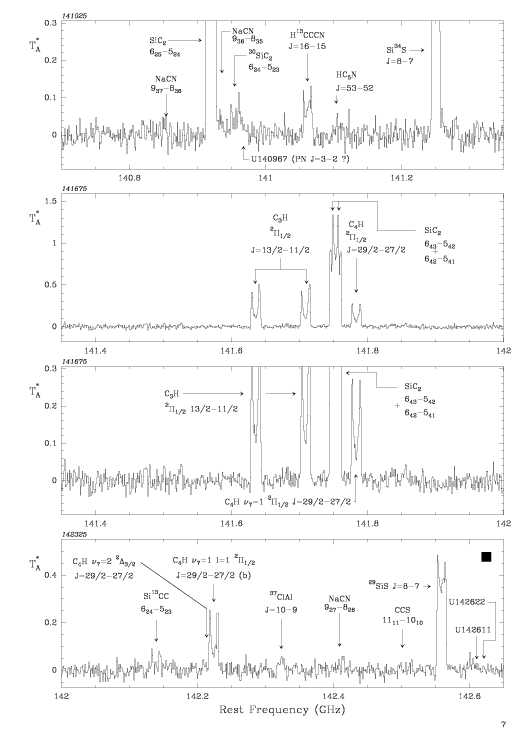
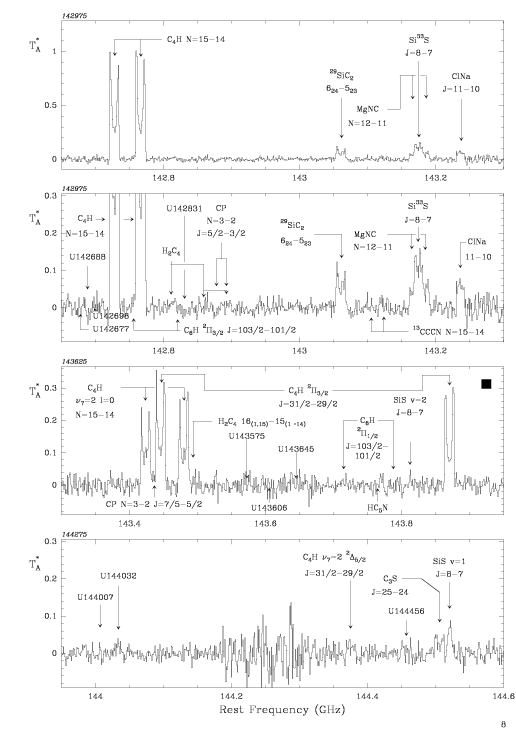
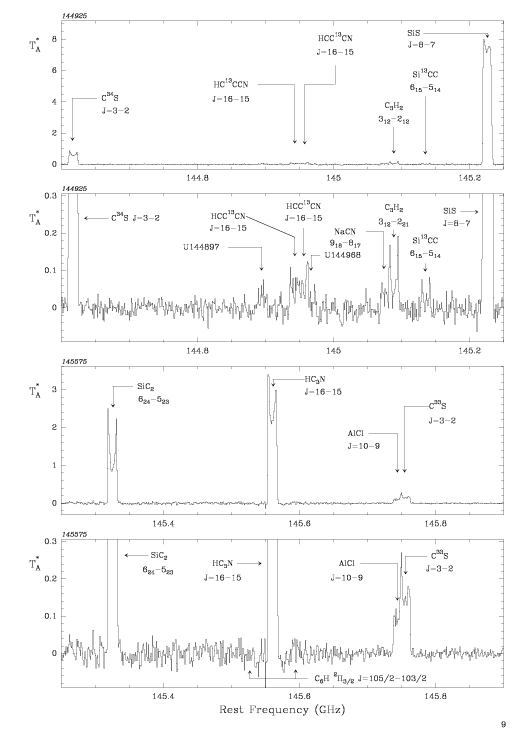
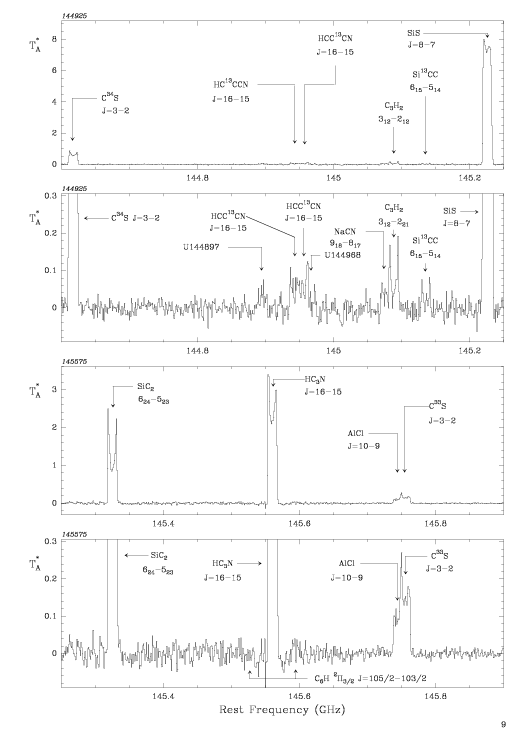
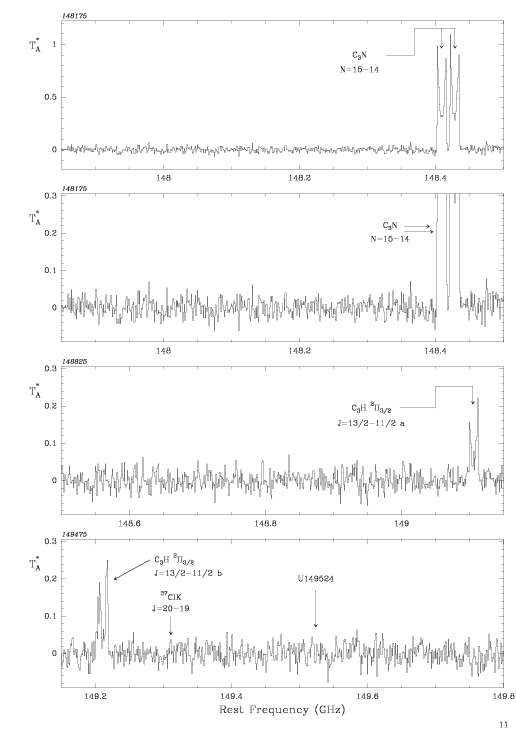
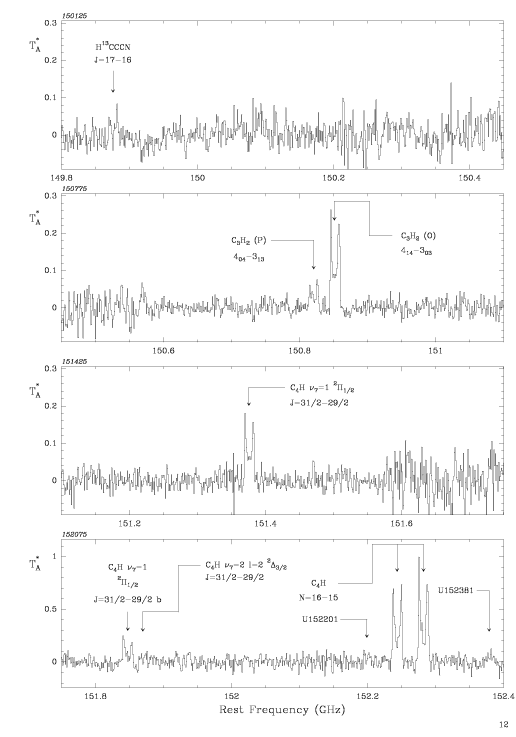
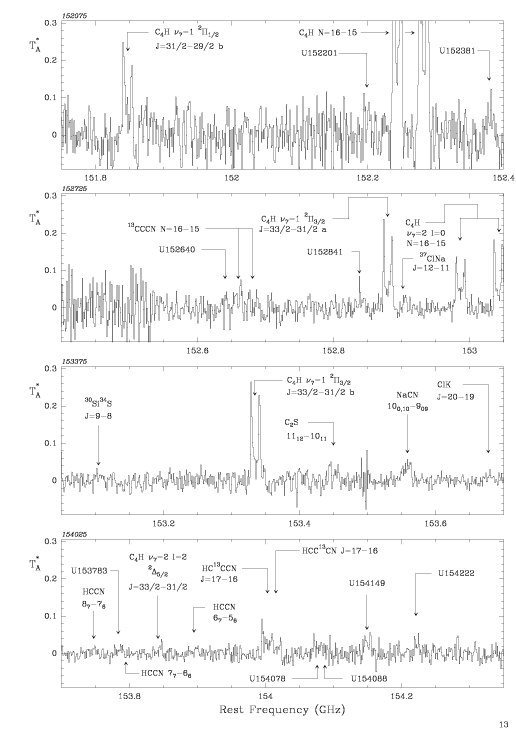
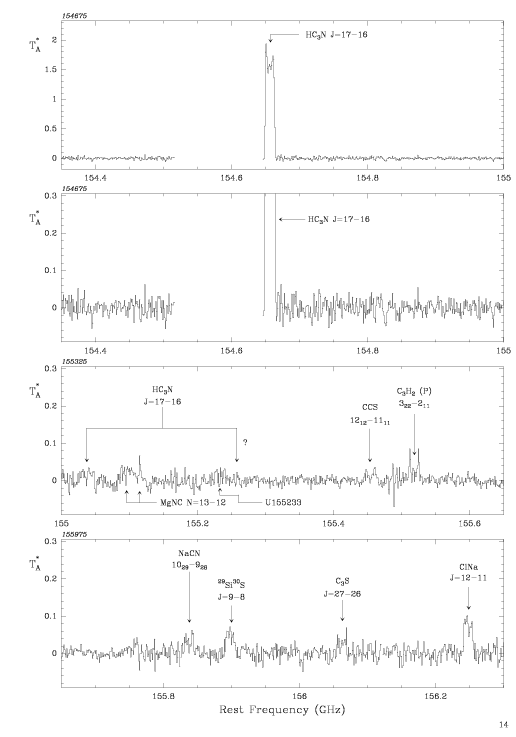
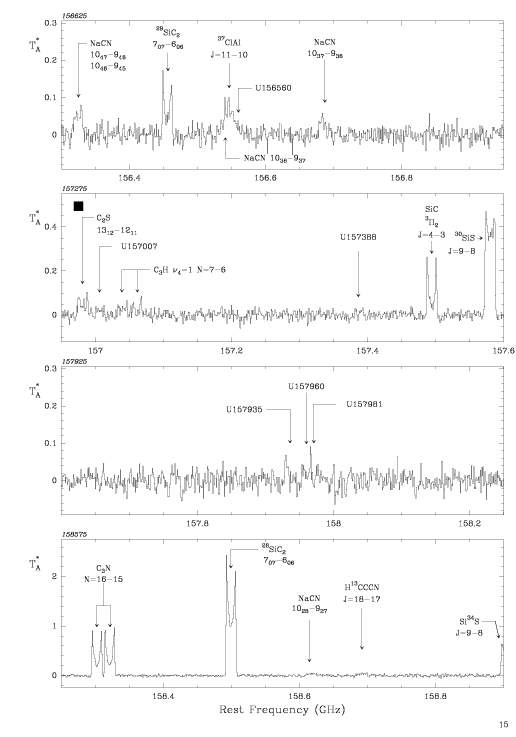
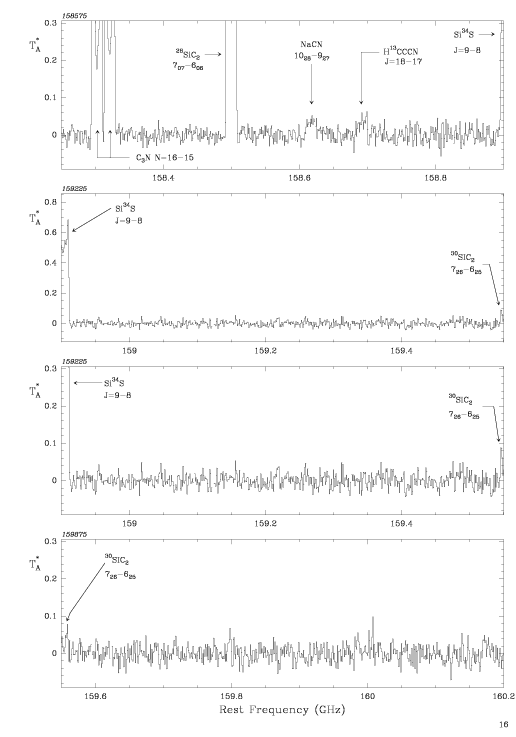
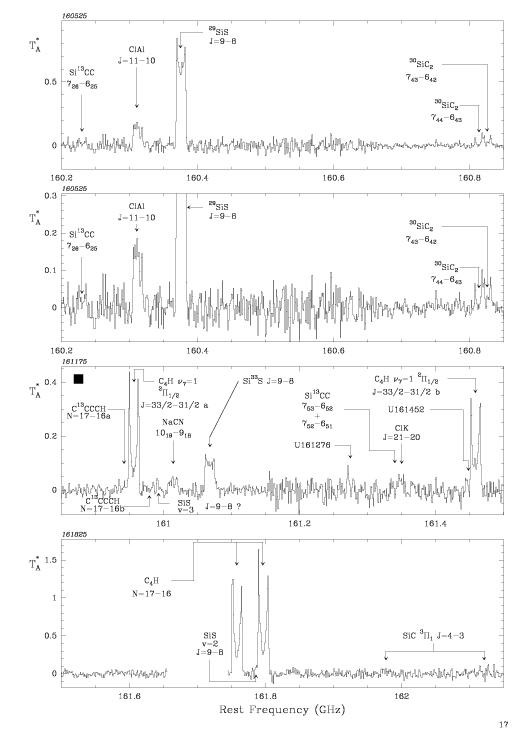
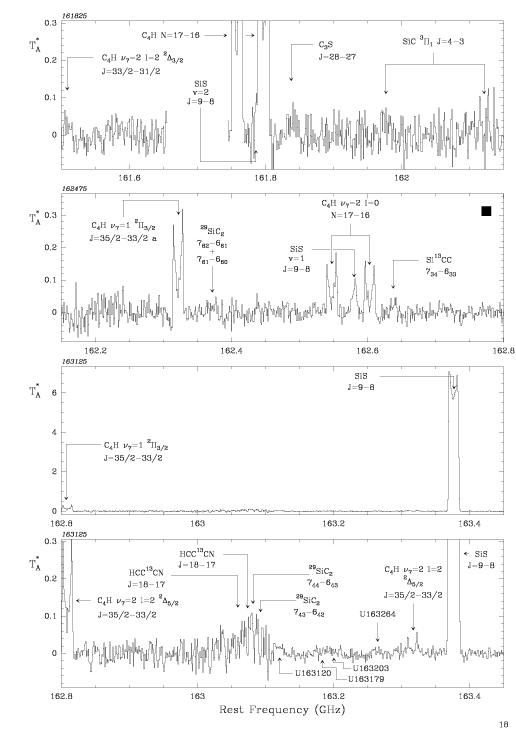
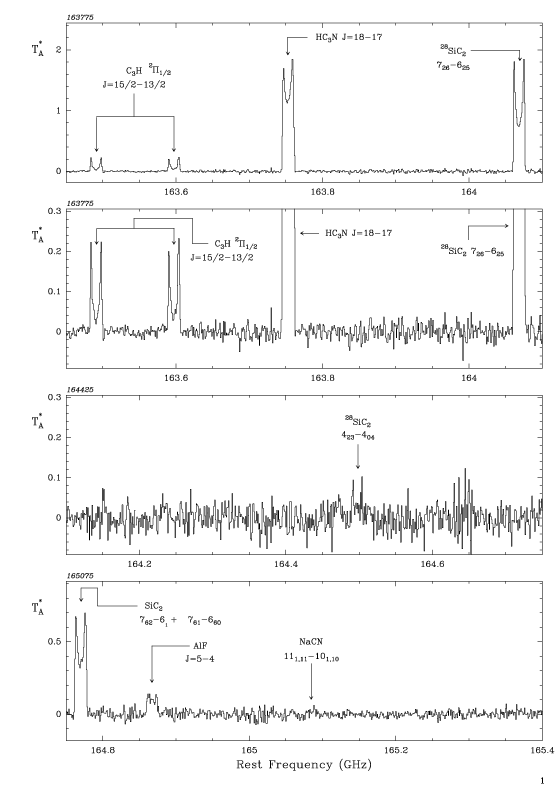
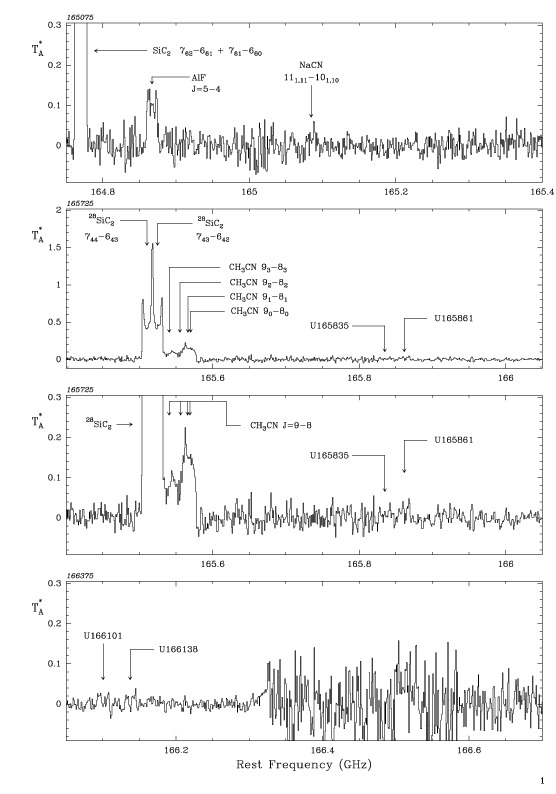
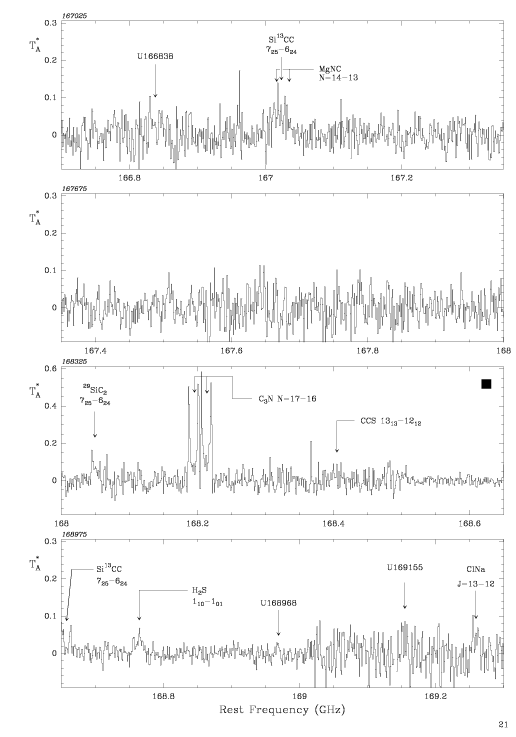
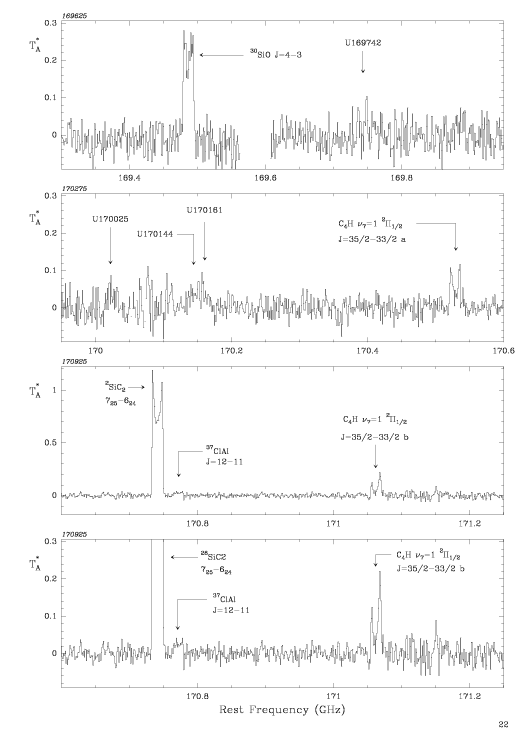
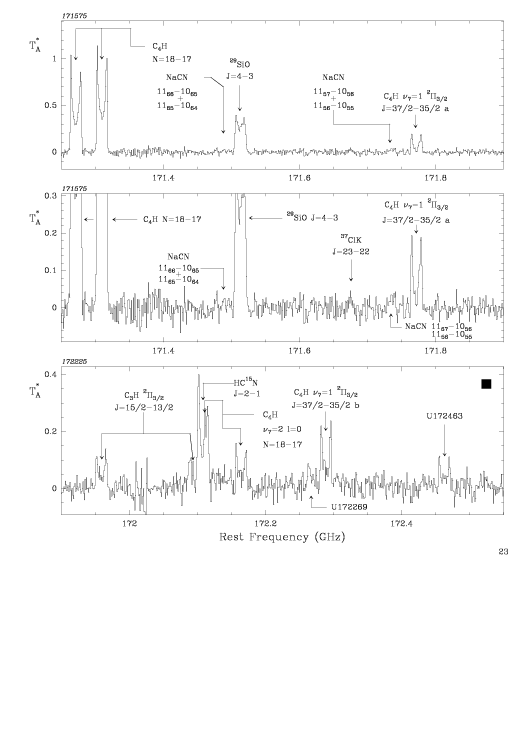
The 2-mm spectral survey of the carbon-star envelope IRC+10216 (IRAM 30m telescope)
Cernicharo, Guelin, Kahane (1998).
Abscissa is the rest frequency calculated for a source LSR velocity of -26.5 km/s. Ordinate is antenna temperature corrected for atmospheric absorption and spillover losses. The complete survey, which covers the frequency interval 129.0-172.5 GHz, is presented in the form of 650 MHz-wide SSB spectra (see below for a short description of the reduction procedure). All spectra are drawn at the same scale $-0.1< T_A^*< 0.3$ K, except for those with peak temeperatures between 0.3 and 0.5 K which are drawn at a slightly reduced scale (they are marked by a black square on the top right corner). The spectra containing strong lines are drawn at normal scale and full scale.
The observations were carried out between 1986 and 1997. The 2-mm SiS mixer receiver was optimized for the lower sideband (LSB) with an attenuation of the upper sideband (USB) between 3 and 20 dB. The central IF frequency was 3.932 GHz. Most spectra were observed with several settings of the local oscillator, using a filterbank consisting of 512 channels with halfpower widths and spacings equal to 1.0 MHz; a few spectra were observed with an autocorrelator or an AOS spectrometer with a half-power channel-width of 1.7 MHz. The data reduction was made in three steps. First, all the noticeable spectral lines were blanked out and a baseline of order $\leq 4$ was subtracted to the individual 0.5 GHz--wide spectra. Then the ghosts of the lines from the USB were identified and removed. Finally, the spectra were aligned in frequency and averaged.
