|
Size: 8933
Comment:
|
Size: 14630
Comment:
|
| Deletions are marked like this. | Additions are marked like this. |
| Line 7: | Line 7: |
| [[NikaRun6|Back to the NIKA run 6]] | <<TableOfContents(3)>> |
| Line 107: | Line 108: |
| --- ''SL 12/06: I don't believe that, this must be something else than just the window; indeed transmission = t = exp(-z * 2 pi n td nu / c), where z = 79 mm on the vertex (lest take 80 mm everywhere to over-estimate the effect, pi=3.1415, n = 1.525 for HDPE at 300K, td = 3.9*10^-4^ for HDPE at 300K, nu = 260 GHz (this value over-estimate a bit the effect for the 1mm band and over-estimate greatly the effect for the 2mm band), c = 3*10^8^ m/s => t = 77% => TRJ = (1-t)*300K = 70K'' --- |
|
| Line 149: | Line 154: |
| The fluctuations of the plate temperature are smaller then yesterday (about 1mk peak to peak- figure08/06-1) with 1.5 hours period. This has an almost impact on the signal (see figure 08/06-2) | Fluctuations of the plate temperature are smaller then yesterday. The first component of about 1mk peak to peak has a period of about 1.5 hours (Fig08/06-1 left). The second component of about 0.1mK has a period of 1.4min (Fig08/06-1 right). Both of these plate fluctuations have a very small impact on data and they should not add any additional noise on scientific data. (see figure 08/06-2). The white noise on pixels is presented in figure 08/06-3. The lines are still present |
| Line 152: | Line 157: |
''Figure-08/06-1: Mixer chamber temperature'' {{attachment:cc1mm.jpg||width=700}} ''Figure-08/06-1: 1mm channel'' |
{{attachment:BM_1.jpg||width=700}} ''Figure-08/06-1: The two components of the mixer chamber temperature fluctuations.'' {{attachment:signal1.jpg||width=700}} {{attachment:signal2.jpg||width=700}} ''Figure-08/06-2: RFdIdQ (about 80min) for 1mm and 2mm channels'' {{attachment:noise1.jpg||width=700}} {{attachment:noise2.jpg||width=700}} ''Figure-08/06-3: Noise spectrum for 1mm and 2mm'' '''19h56 : Opacity 1.5!!! Be of good auspice for the next week.....''' === Sun 09/06 === Fluctuations of the plate temperature are getting worse. The mixing chamber temperature has a fluctuation of 1.5mK with a period of about 1.5min (see Fig09/06-1). This has as impact on the signal as shown in Fig09/06-2. The plan is to recycle the cryostat on Monday morning. This should (hopefully) stabilize the working temperature for the whole campaign. {{attachment:BM_2.jpg||width=700}} ''Figure-09/06-1: The mixer chamber temperature fluctuations.'' {{attachment:signal_11.jpg||width=700}} {{attachment:signal_12.jpg||width=700}} ''Figure-09/06-2: RFdIdQ for 1mm and 2mm channels'' === Tue 11/06 === FXD, RA, AD, MC, SL, NB at the telescope Dilution fridge recycled yesterday (warm enough to turn He to gas, pump, cool down again). Base temperature stabilized around 216 mK naturally (with setting of 3He circulation, trying to mitigate strongly the fluctuations due to the small leak). Laser alignment before lunch (+ tight screws of NIKA table leg & micrometric screws fixation on M5). Check pako scripts during the maintenance. Obs plan: check resonance, pointing & focus, 1st skydip, 1st far field geometry, pointing session, implement pointing model, calibration sequences iterations. '''First Skydip Reduction on scan 159. The ration between Tau2mm and Tau1mm is 0.64. The IRAM taumeter at 225GHz give a tau = 0.752''' {{attachment:res_skydip_up_20130611-159.jpg||width=700}} {{attachment:skydip_up_20130611-159.jpg||width=700}} ''Figure-11/06-1: First Sky Dip reduction data (scan 159). Top: the Elevation of the telescope vs time. Bottom: the skydip reduction results.'' Alessandro: please note that the 2mm array, compared to the one used in run 5, has a spectrum peaked at higher frequency (155GHz vs. 145GHz) in order to avoid as much as possible the Oxygen line at 110GHz. Is the ratio different compared to run 5 ? Very nice result!!! NB has a table of tau(nu) = a(nu) + b(nu) * pwv which I had created from the ATM model. If the weighted mean center frequencies of the 2 and 1mm bands are known, we have the expected opacity ratio. (CK) === Wed 12/06 === We didn't have the time to follow the complete plan from yesterday; 1st we spent some time on finding the frequencies (we have 128 valid pixel at 2mm [132 pixels total on the array] and 190 valid pixels at 1 mm [224 pixels total on the array]), doing test on the tuning of the detectors, getting our 1st far field geometries (otf_geometry), test the various scan scripts (pointing crosses and Lissajous, zigzag (otf) maps and Lissajous maps, skydips, test teh data handling, formatting, transfer (raw data & antenna FITS for the IDL pipeline, IMBFITS for mopsic), processing (ILD scripts for quick looks), try to start to get some pointing statistics, do radio alignment (moving the micrometric screws on the back of M5), try standard focus and Lissajou focus, check the offset of the optical axis on the array, correct the Nasmyth offset to get the optical axis close to the reference pixel we choose near the center of the arrays. Opacity pretty bad all day long (~0.9 e.i. ~15 mmpwv). For more details check the 1st sheet of the [[http://www.iram.es/IRAMES/mainWiki/D2DLogNika6|Day to day observing log]]. Simulation in Zemax of the effect of the focus on the PSF: left image = standard focus (Z axis), centre image = lateral focus X axis, right image = lateral focus Y axis ; top sub-images = central pixel, bottom sub-images = edge pixel at 2' FOV ; left sub-images = defocus by 1 mm, centre sub-images = perfectly focussed, right sub-images = defocus by -1 mm: {{attachment:focus_+1_0_-1_on_0arcmin_&_2arcmin_PSF.PNG||width=400}} {{attachment:focusLatX_+1_0_-1_on_0arcmin_&_2arcmin_PSF.PNG||width=400}} {{attachment:focusLatY_+1_0_-1_on_0arcmin_&_2arcmin_PSF.PNG||width=400}} Goal for today: pointing, focus, geometry on Mars, check that with the Nasmyth offset we set yesterday the pointing at different elevation is still close to the central pixel, transfer this offset to the pointing model (NCS parameters) and set the offset in pako back to 0, check it is consistent, then do the pointing session. Update at mid afternoon: tau is really too bad (~1); we tried crosses on 2 quasars but the results are extremely noisy, so we can't do the pointing session. Instead we try various focus and geometry on Mars, and try Lissajous pointings which will generate longer integration time of the pointing sources than the simple crosses, and check can see the sources with a reasonable accuracy. |
Go to preparation run daily reports
Preparation visit before Run6
Contents
Daily Reports
Mon 03/06
Left Grenoble by car in the morning. Andrea, Alain, Alessandro. Reached the telescope at 20h30.
Tue 04/06
During the maintenance craned up again NIKA, installed. Warm impedance test: 20mbar/min at 3 bar
Start cooling down at 13h30.
Test with VNA at 300K:
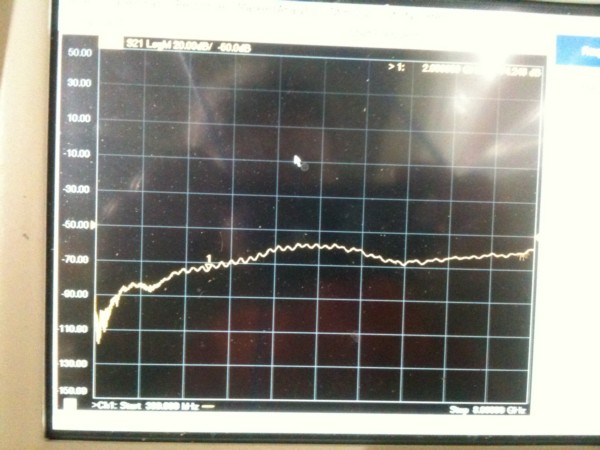
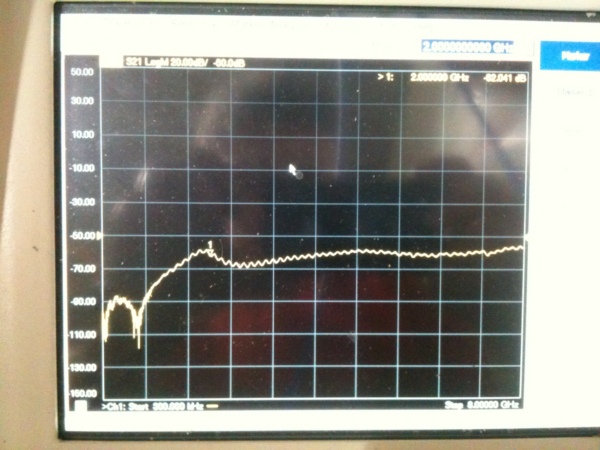
Figures: VNA scans at 300K (0-8GHz). Left: 1mm array; right: 2mm array. Vertical scale 20dB/div.
Installed the electronics with the cables.
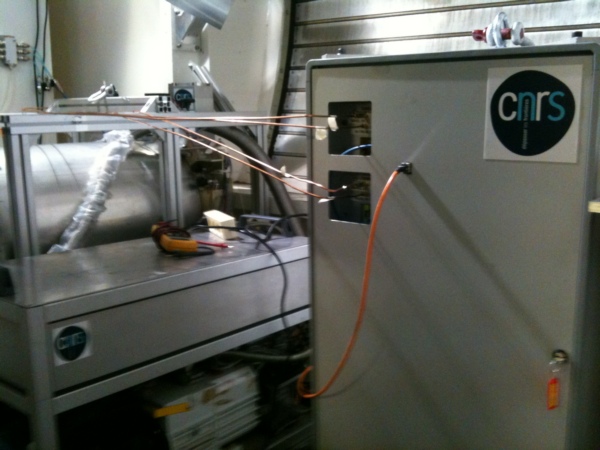
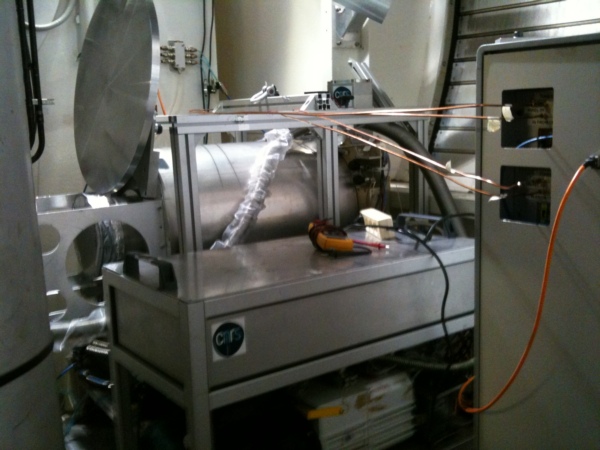
Figures: NIKA installed again.
We have also visited the back of the antenna and in particular the receivers cabin roof for possible installation of the NIKA-2 electronics. Space available is 80cm (H) x 200cm (Width) x 100cm (Depth). In order to have enough space to work, we will use a maximum depth of 60cm. The total COAX cables length if this solution is chosen is 6-8m.

Figures: Cabin top, possible place for NIKA-2 electronics.
Cryostat temperatures at 18h (T0 + 4h30). 4K: 255K (14K/h slope); Still: 235K (25K/h slope); R_BM: 1011 Ohm.
The 4K is slower compared to the last Grenoble runs. We have checked the PT compressor pressures and they're OK: high=28.5bar; low=10bar. So we haven't lost helium. At 18h20 we reduce a bit the preref flux (from 1000mbar to 900mbar) to see if the 4K was affected (it shouldn't in principle). Actually YES, the 4K accelerated and the still slowed down a bit.
Cryostat temperatures at 20h30 (T0 + 7h). 4K: 207K (20K/h slope); Still: 165K (27K/h slope); R_BM: 1020 Ohm.
Cryostat temperatures at 22h30 (T0 + 9h). 4K: 164K (20K/h slope); Still: 115K (22K/h slope); R_BM: 1026 Ohm.
Wed 05/06
Cooling a bit slower than last time in Grenoble but still comparable. Hopes for condensation start in the morning. Pressures in the PT compressor: 27bar (high); 10bar (low).
Cryostat temperatures at 9h30 (T0 + 20h). 4K: 6.5K (0.4K/h slope); Still: 9.2K (4K/h slope); R_BM: 1190 Ohm (10.3K).
Cryostat temperatures at 10h30 (T0 + 21h). 4K: 5.7K; Still: 7.1K; R_BM: 1220 Ohm (8.9K).
11h (T0+21.5h) START CONDENSATION.
12h15. Condensation started OK, mixing chamber cooling fast, Switching ON the cold amplifiers to check arrays connections. Waiting for the superconducting T.
12h45. Both arrays seem CONNECTED. The Tc is between 1.35 and 1.5K (but mixing chamber thermometer calibration is not perfect) and as expected the transition is seen on the 2mm array first.
16h30. RESONANCES !!! 198 at 1mm, 129 at 2mm. Cryostat reached 120mK at least but oscillating and now heating up around 200mK again. Noise (very preliminary) seems OK on both arrays: 1Hz/sqrt(Hz) on the 2mm, 3Hz/sqrt(Hz) on, the 1mm. Ongoing..
18h00. The first test we made is to turn the antenna by 180deg in AZ (EL was roughly 45deg) to check if the resonances are stable with B fields or not. They seem stable enough, but very small (around 20Hz only) jumps are in any case seen on some pixels of the 2mm array during the slew.
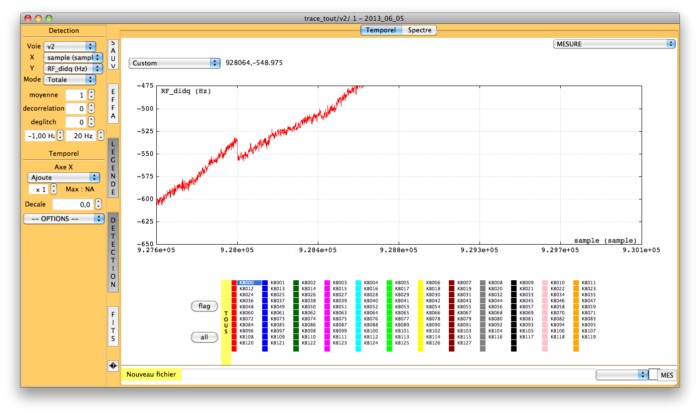
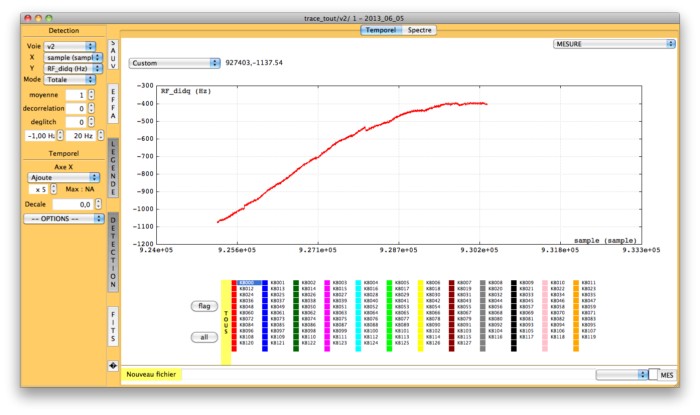
Figures: Small jumps on one pixel (2mm array) during 180deg slew in AZ. The drift in the time trace is due to temperature drift of the mixing chamber during the test.
Nicolas, working remotely from Grenoble, analyzed the timelines during the slew and found 3-4 detectors exhibiting larger jumps (see next figure), of about 1kHz.
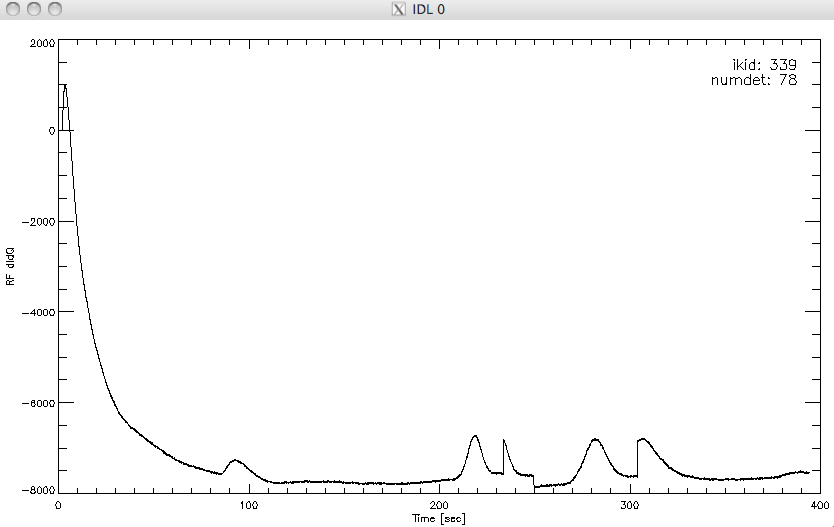
Figure: Bigger jumps on a particular pixel (1mm array, numdet=78) during 180deg slew in AZ (NP).
Thu 06/06
1h00. Added roughly 30mbar of 3He in the reserve.
08h30. The cryostat spent in any case the night oscillating.
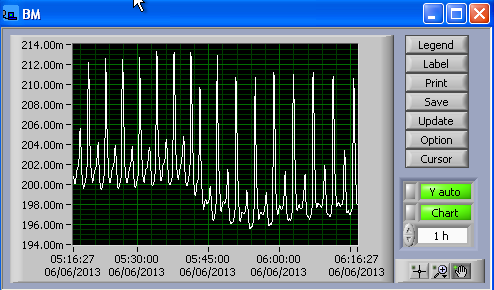
Figure: Mixing chamber of the cryostat oscillating.
The heater on the mixing chamber, allowing to regulate the temperature, is broken inside the cryostat ! So no regulation possible unfortunately. That's a bit annoying since we are also quite warm with the cryostat in this shape.
The white noise on the arrays seems good, but there are lines at 0.96Hz (both arrays), 1.9Hz (1mm) and higher (mostly 1mm array).
Y9_10h11 (2mA chauffage, oscillations 204-216mK periode 150s, J4=980mbar)
Y9_10h38 (2.3mA chauffage, oscillations 208-215mK periode 150s, J4=1020mbar)
Y9_10h58 (2.6mA chauffage, oscillations 0.1-1mK periode 150s, J4=1530mbar)
In this last conditions it seems more or less stable, but at 220mK. J4 is not too high. The detectors are working (the 1mm a bit limited), so we decide to leave it alone.
Parameter files: run6_window.txt AND run_6_300K.txt (on archeops9 and archeops10).
The 2mm array has been adjusted, the 1mm not yet.
On the 2mm array, from window closed to 300K (window open, looking at the cabin), the frequency shift is 100kHz. In Grenoble this array exhibited a shift of about 180kHz between 80K and 300K, equivalent to 0.8kHz/K. So, it seems that the windows is only equivalent to 300-100/0.8=175K. LN2 in front of the window determines a shift of 60kHz on the 2mm array (means the LN2 is colder than the window by 60KHz on average). Assuming the Grenoble calibration of 0.8KHz/K it means a Delta_T of 75K. So from this we would conclude that the window is 77+75=152K. Not too far from the 175K estimated starting from the 300K. SO THE WINDOW IS EQUIVALENT TO 160+/-10K !!!
On the 1mm array, from window closed to 300K (window open, looking at the cabin), the frequency shift is 150kHz. Remember we have one additional filter 9cm-1 this time. This might reduce a bit the sensitivity. LN2 in front of the window determines a shift of 110kHz on the 1mm array
---
SL 12/06: I don't believe that, this must be something else than just the window; indeed transmission = t = exp(-z * 2 pi n td nu / c), where z = 79 mm on the vertex (lest take 80 mm everywhere to over-estimate the effect, pi=3.1415, n = 1.525 for HDPE at 300K, td = 3.9*10-4 for HDPE at 300K, nu = 260 GHz (this value over-estimate a bit the effect for the 1mm band and over-estimate greatly the effect for the 2mm band), c = 3*108 m/s => t = 77% => TRJ = (1-t)*300K = 70K ---
..... Mon-Tue 10-11/06 'TO DO LIST' FOR MARTINO (sorry, in italian)
- Scan VNA sulle matrici (finestra chiusa e finestra aperta) con il PC del VNA.
- Verificare i params e, soprattutto per la 1mm, aggiustare i livelli di potenza. Sulla 2mm dovrebbero essere già giusti più o meno, ma per favore ricontrolla se hai tempo. I params, che trovi su archeops9 (nella directory .../Data/param), si chiamano "run6_window.txt" e "run6_300K.txt". Per la 1mm i livelli sono tutti da fare.
- allineamento (con Santiago e Nello martedi' mattina). Attenzione, i piedini regolabili sono molto più alti dell'ultima volta. La tavola anti-vibrazione è già in funzione. Al piano dove c'e' l'elettronica di GISMO abbiamo trovato una tavola inutilzzata con 4 piedini di quel tipo. Se per caso uno dei nostri si dovesse rompere, chiedete di smontarne uno di quelli.
- PRENDERE TEMPO (tutto il tempo che serve !) PRIMA DI OSSERVARE SORGENTI ETC. PER RIFARE UN BUON PARAM SUL CIELO. Da fare martedi' alla first light. Quindi dite che avete bisogno di 1-2 ore per fare quello prima di mettersi a fare OTF_geometry etc.
- controllare sempre il criostato. J4 non deve esplodere (diciamo rimanere stabile attorno a 1.5bar o un po' più, ma non andare verso i 3 bar. Il tutto è in equilibrio instabile
- ho l'impressione che non si debbano schtchare i cavi semirigidi sulle barre del criostato. Ho messo degli "attenuatori di vibrazione" al posto. Mi sembra che questo riduca le righe di rumore almeno sulla 2mm. Ma magari è un mito.
- tutte le nostre cose, da riportare a Grenoble, sono al piano appena sotto la cabina e in un angolo al piano del compressore. Un po' oltre la "trap", contro il muro sulla destra.
.... altre cose che vi verranno in mente.
Fri 07/06
10h30 Alain and Alessandro left the telescope.
11h00 Add parameter file: run6_77K.txt (on archeops9) levels adjusted on 1mm and 2mm channels
After an instability of the cryostat during the last night, temperature fluctuations of the Still are increasing. This can be observed on the pirani gauge (see figure-07/06-1). The impact on data is still not dramatic as shown in figures-07/06-2 (hoping don't get worse).
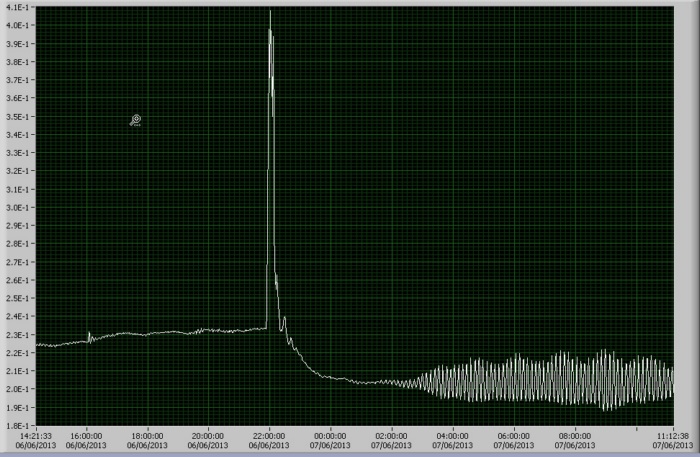
Figure-07/06-1: Pirani gauge
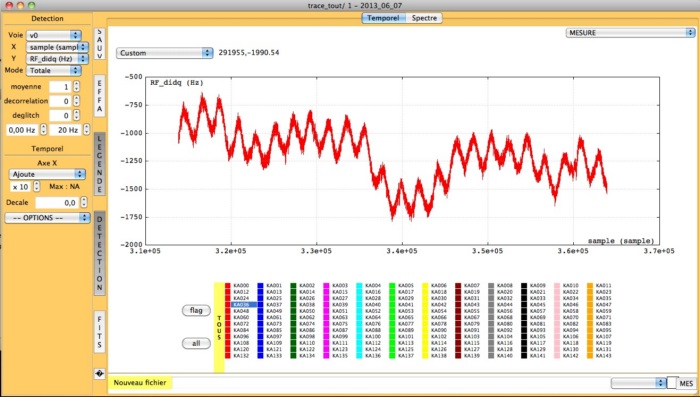
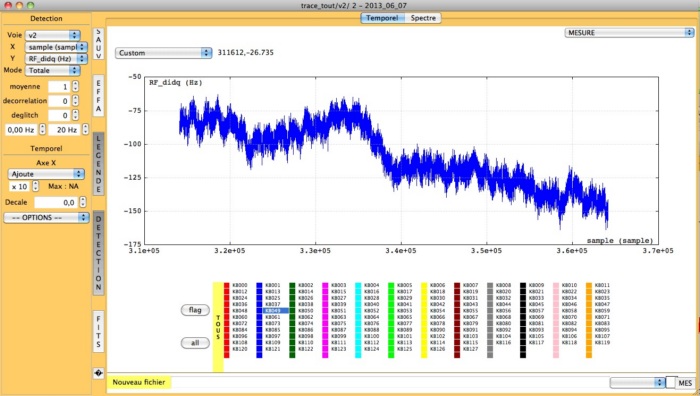
Figure-07/06-2: Impact of 100mk plate temperature fluctuations on 1mm and 2mm channel.
Sat 08/06
Fluctuations of the plate temperature are smaller then yesterday. The first component of about 1mk peak to peak has a period of about 1.5 hours (Fig08/06-1 left). The second component of about 0.1mK has a period of 1.4min (Fig08/06-1 right). Both of these plate fluctuations have a very small impact on data and they should not add any additional noise on scientific data. (see figure 08/06-2). The white noise on pixels is presented in figure 08/06-3. The lines are still present
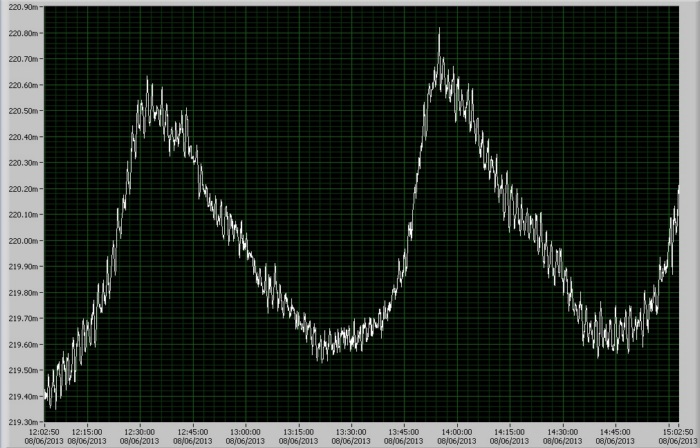
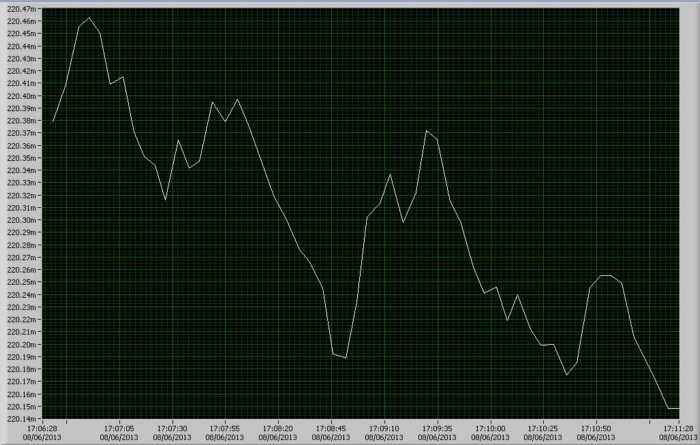
Figure-08/06-1: The two components of the mixer chamber temperature fluctuations.
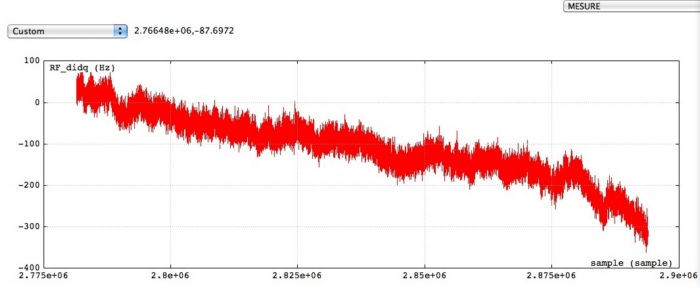
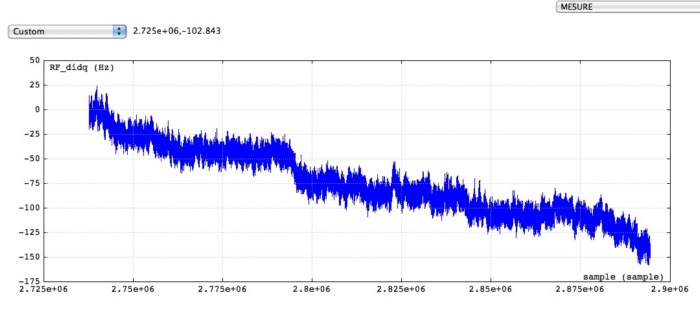
Figure-08/06-2: RFdIdQ (about 80min) for 1mm and 2mm channels
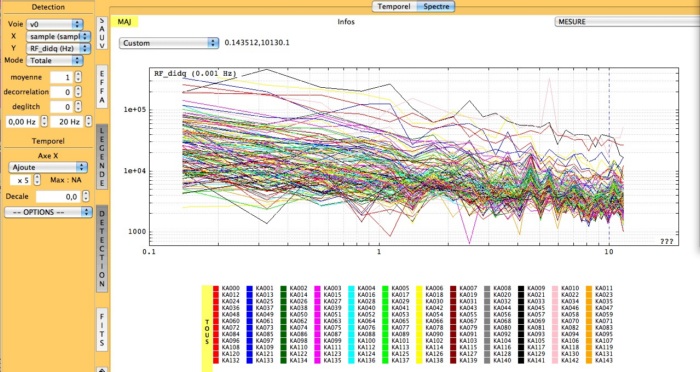
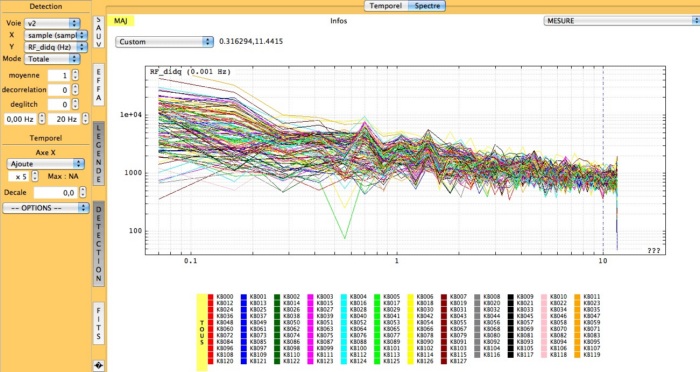
Figure-08/06-3: Noise spectrum for 1mm and 2mm
19h56 : Opacity 1.5!!! Be of good auspice for the next week.....
Sun 09/06
Fluctuations of the plate temperature are getting worse. The mixing chamber temperature has a fluctuation of 1.5mK with a period of about 1.5min (see Fig09/06-1). This has as impact on the signal as shown in Fig09/06-2. The plan is to recycle the cryostat on Monday morning. This should (hopefully) stabilize the working temperature for the whole campaign.
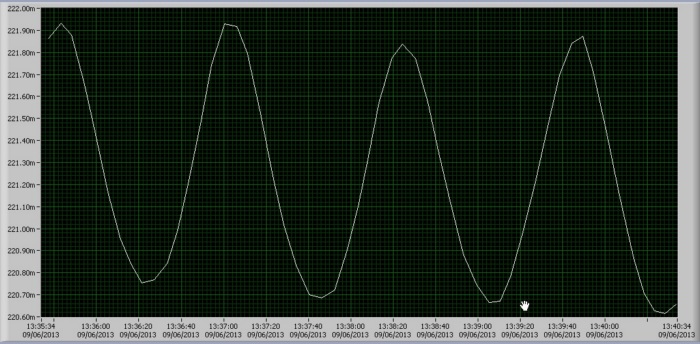
Figure-09/06-1: The mixer chamber temperature fluctuations.
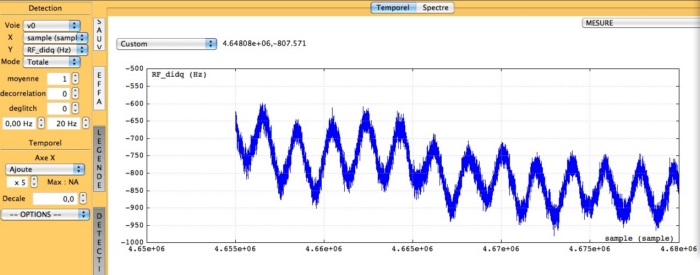
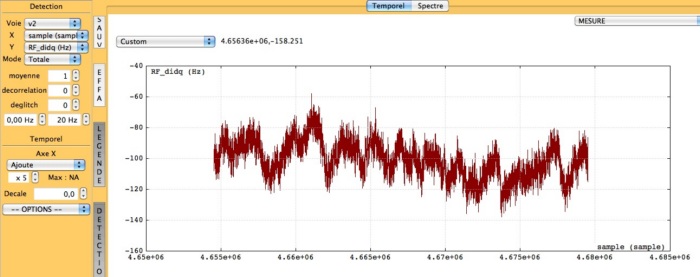
Figure-09/06-2: RFdIdQ for 1mm and 2mm channels
Tue 11/06
FXD, RA, AD, MC, SL, NB at the telescope
Dilution fridge recycled yesterday (warm enough to turn He to gas, pump, cool down again). Base temperature stabilized around 216 mK naturally (with setting of 3He circulation, trying to mitigate strongly the fluctuations due to the small leak).
Laser alignment before lunch (+ tight screws of NIKA table leg & micrometric screws fixation on M5). Check pako scripts during the maintenance.
Obs plan: check resonance, pointing & focus, 1st skydip, 1st far field geometry, pointing session, implement pointing model, calibration sequences iterations.
First Skydip Reduction on scan 159. The ration between Tau2mm and Tau1mm is 0.64. The IRAM taumeter at 225GHz give a tau = 0.752
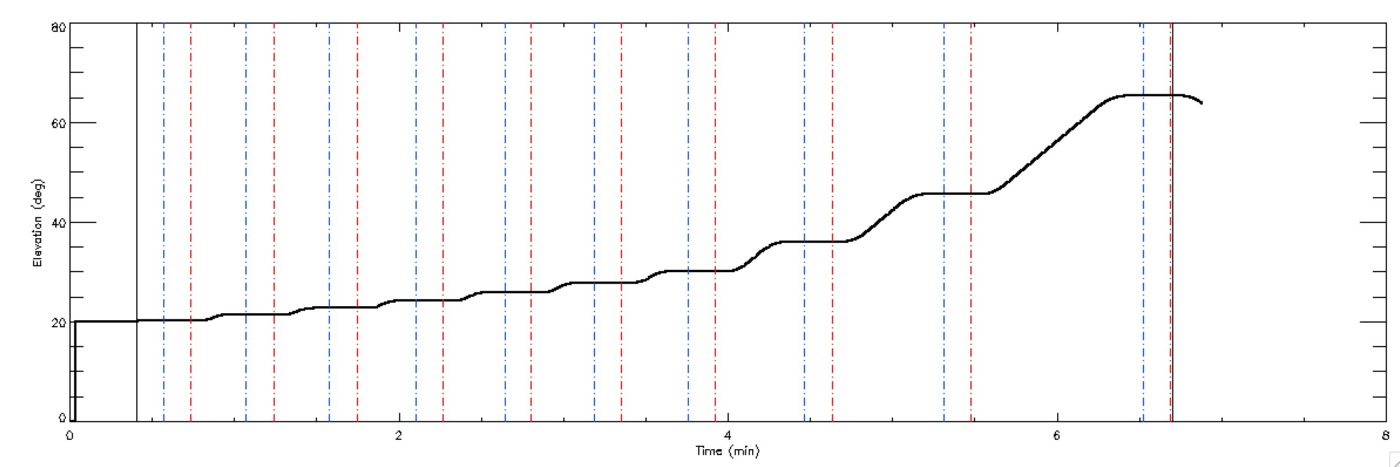

Figure-11/06-1: First Sky Dip reduction data (scan 159). Top: the Elevation of the telescope vs time. Bottom: the skydip reduction results.
Alessandro: please note that the 2mm array, compared to the one used in run 5, has a spectrum peaked at higher frequency (155GHz vs. 145GHz) in order to avoid as much as possible the Oxygen line at 110GHz. Is the ratio different compared to run 5 ?
Very nice result!!! NB has a table of tau(nu) = a(nu) + b(nu) * pwv which I had created from the ATM model. If the weighted mean center frequencies of the 2 and 1mm bands are known, we have the expected opacity ratio. (CK)
Wed 12/06
We didn't have the time to follow the complete plan from yesterday; 1st we spent some time on finding the frequencies (we have 128 valid pixel at 2mm [132 pixels total on the array] and 190 valid pixels at 1 mm [224 pixels total on the array]), doing test on the tuning of the detectors, getting our 1st far field geometries (otf_geometry), test the various scan scripts (pointing crosses and Lissajous, zigzag (otf) maps and Lissajous maps, skydips, test teh data handling, formatting, transfer (raw data & antenna FITS for the IDL pipeline, IMBFITS for mopsic), processing (ILD scripts for quick looks), try to start to get some pointing statistics, do radio alignment (moving the micrometric screws on the back of M5), try standard focus and Lissajou focus, check the offset of the optical axis on the array, correct the Nasmyth offset to get the optical axis close to the reference pixel we choose near the center of the arrays. Opacity pretty bad all day long (~0.9 e.i. ~15 mmpwv). For more details check the 1st sheet of the Day to day observing log.
Simulation in Zemax of the effect of the focus on the PSF: left image = standard focus (Z axis), centre image = lateral focus X axis, right image = lateral focus Y axis ; top sub-images = central pixel, bottom sub-images = edge pixel at 2' FOV ; left sub-images = defocus by 1 mm, centre sub-images = perfectly focussed, right sub-images = defocus by -1 mm:
Goal for today: pointing, focus, geometry on Mars, check that with the Nasmyth offset we set yesterday the pointing at different elevation is still close to the central pixel, transfer this offset to the pointing model (NCS parameters) and set the offset in pako back to 0, check it is consistent, then do the pointing session.
Update at mid afternoon: tau is really too bad (~1); we tried crosses on 2 quasars but the results are extremely noisy, so we can't do the pointing session. Instead we try various focus and geometry on Mars, and try Lissajous pointings which will generate longer integration time of the pointing sources than the simple crosses, and check can see the sources with a reasonable accuracy.
