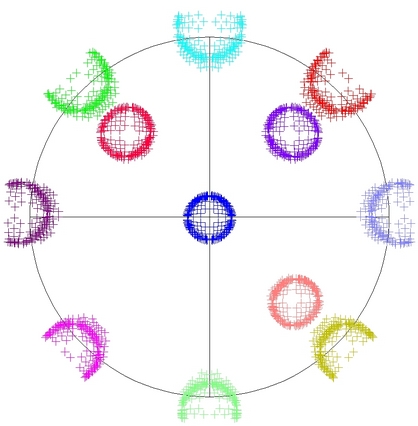
Prediction of field distortion from Zemax simulations, June 1, 2012, SL
- Example for the 2mm array (which has the bigger FOV in the June 2012 configuration, hence the biggest distortions):
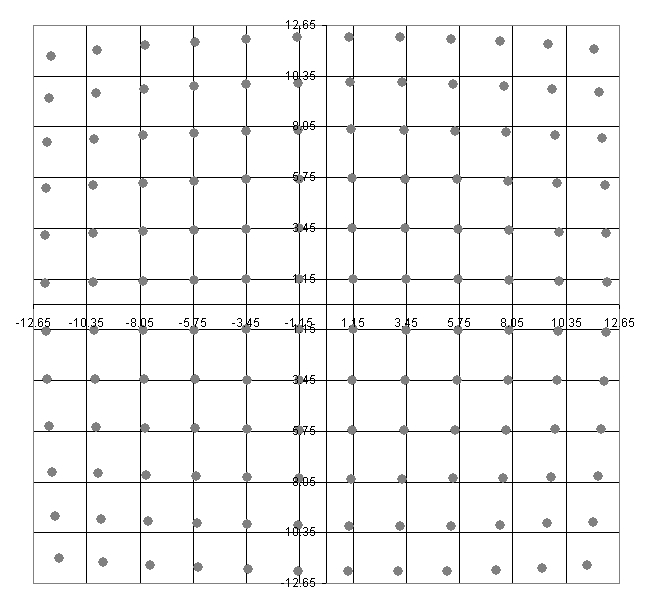
Equations and more details: NIKA_2012_grid_distortion.pdf
Grid distortion output from zemax (attention this is the position of incoming rays with respect to a regular grid on the image, that is to say the inverse of the FOV distortion !): 12x12 grid 14x14 grid
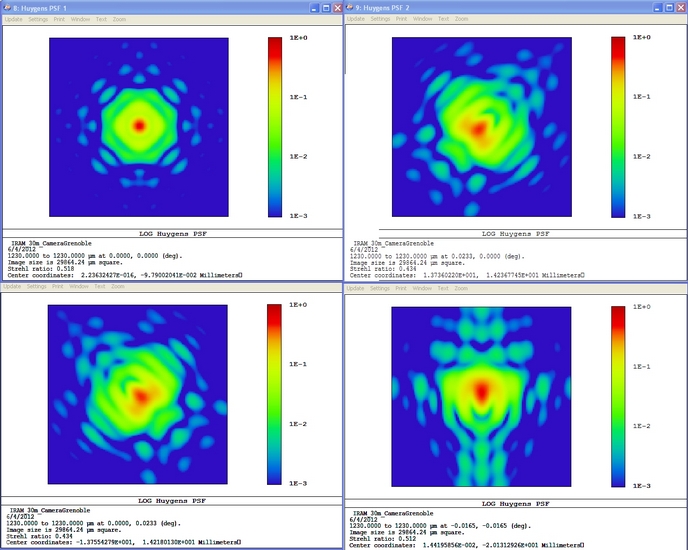
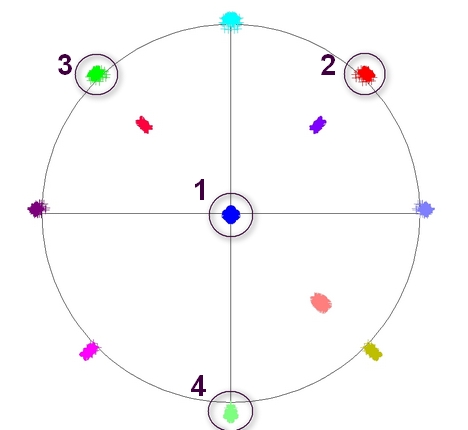
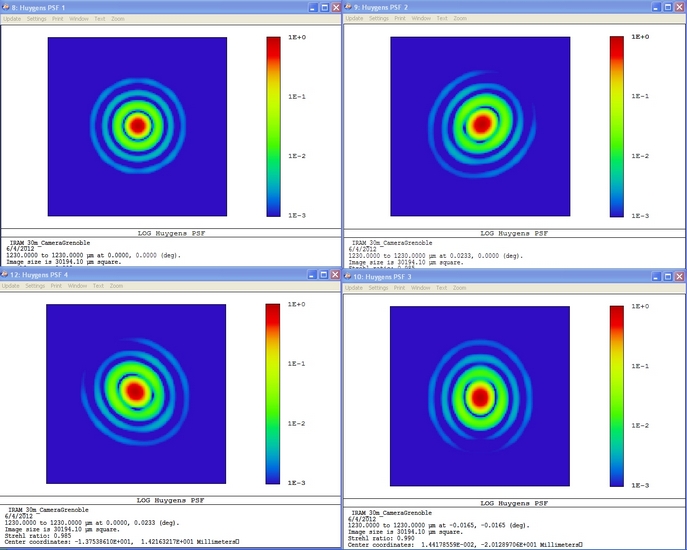
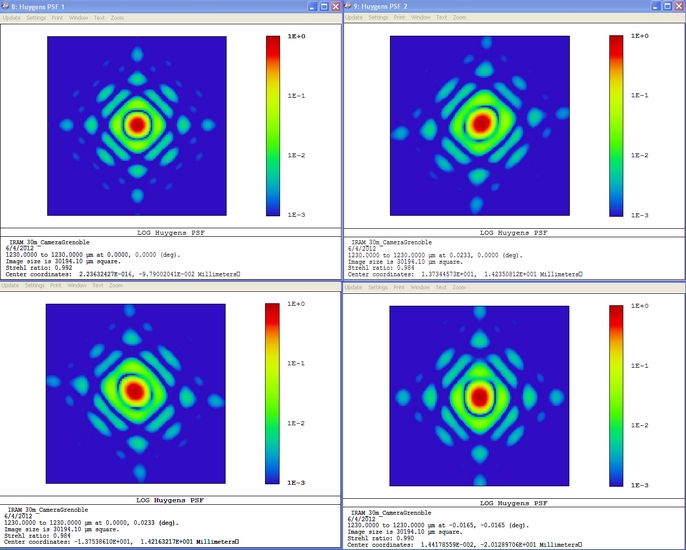
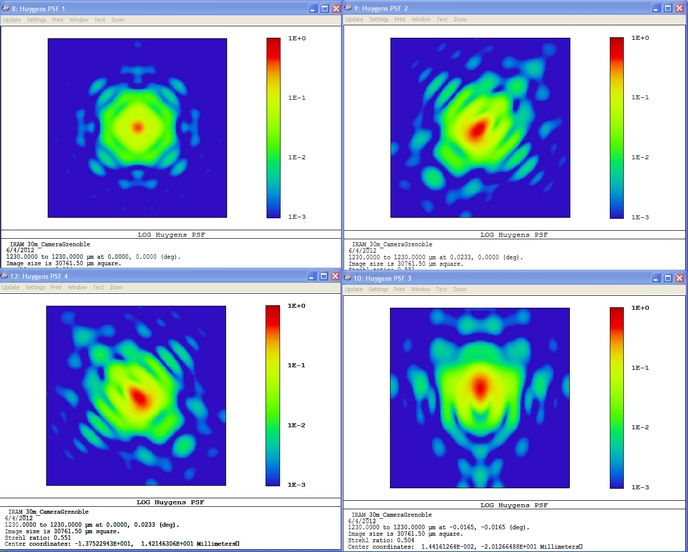
PSF simulated with Zemax at different foci
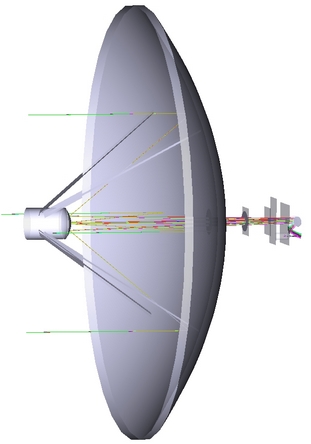
- Image 1 = 30m telescope with NIKA simulated in ZEMAX, including the tetrapod (arms holding M2 from M1 at ~2/3rd of its radius )
- Image 2 = Image plane (on KID array) at nominal focus (M2 = 0), fields numbered from 1 to 4 = fields shown on the PSF images; 1 = top left, 2 = top right, 3 = bottom left, 4 = bottom right
- Image 3 = PSF at nominal focus (M2 = 0), without the tetrapod
- Image 4 = PSF at nominal focus (M2 = 0), with the tetrapod
Text files of the 4 PSF shown in image 4: field 0 field +X field +Y field -X-Y
- Image 5 = Image plane with positive defocus focus (M2 = +1mm)
- Image 6 = PSF with positive defocus focus (M2 = +1mm)
Text files of the 4 PSF shown in image 6: field 0 field +X field +Y field -X-Y
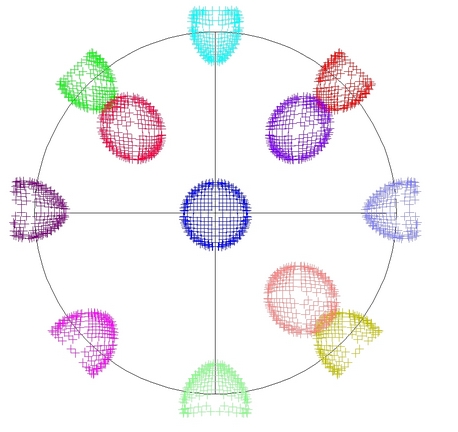
- Image 7 = Image plane with negative defocus focus (M2 = -1mm)
- Image 8 = PSF with negative defocus focus (M2 = -1mm)
Text files of the 4 PSF shown in image 8: field 0 field +X field +Y field -X-Y
