|
Size: 237
Comment:
|
Size: 357
Comment:
|
| Deletions are marked like this. | Additions are marked like this. |
| Line 4: | Line 4: |
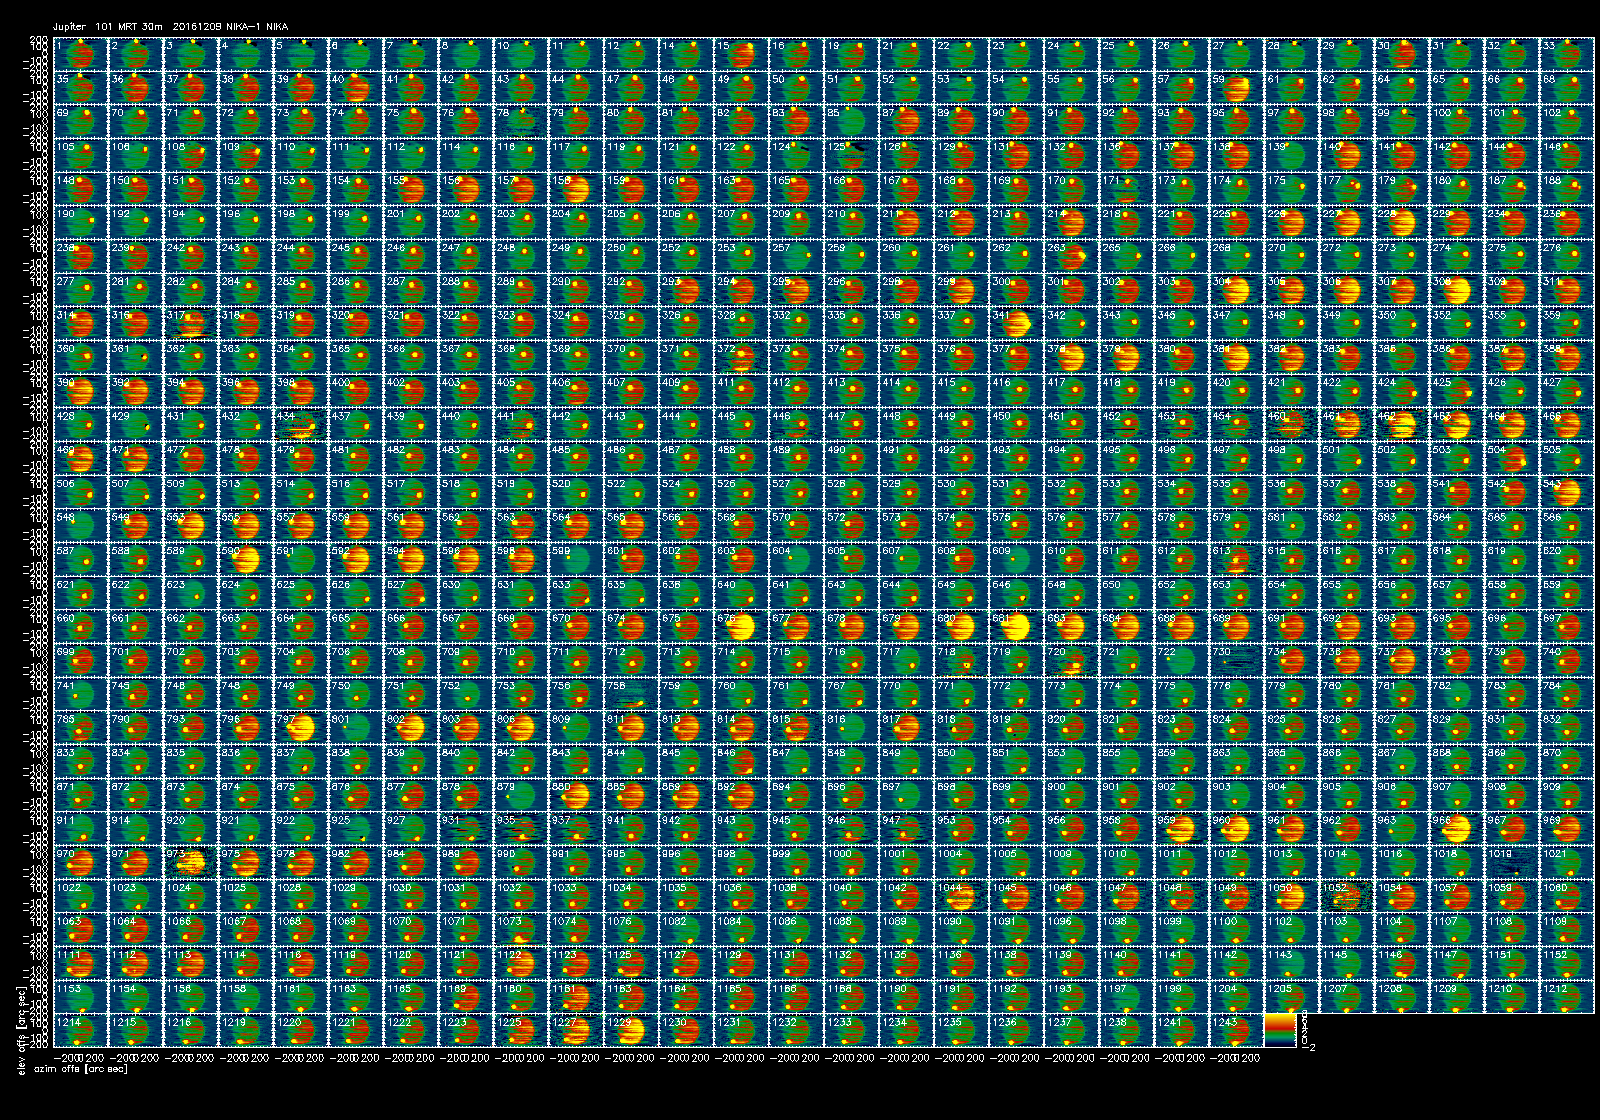
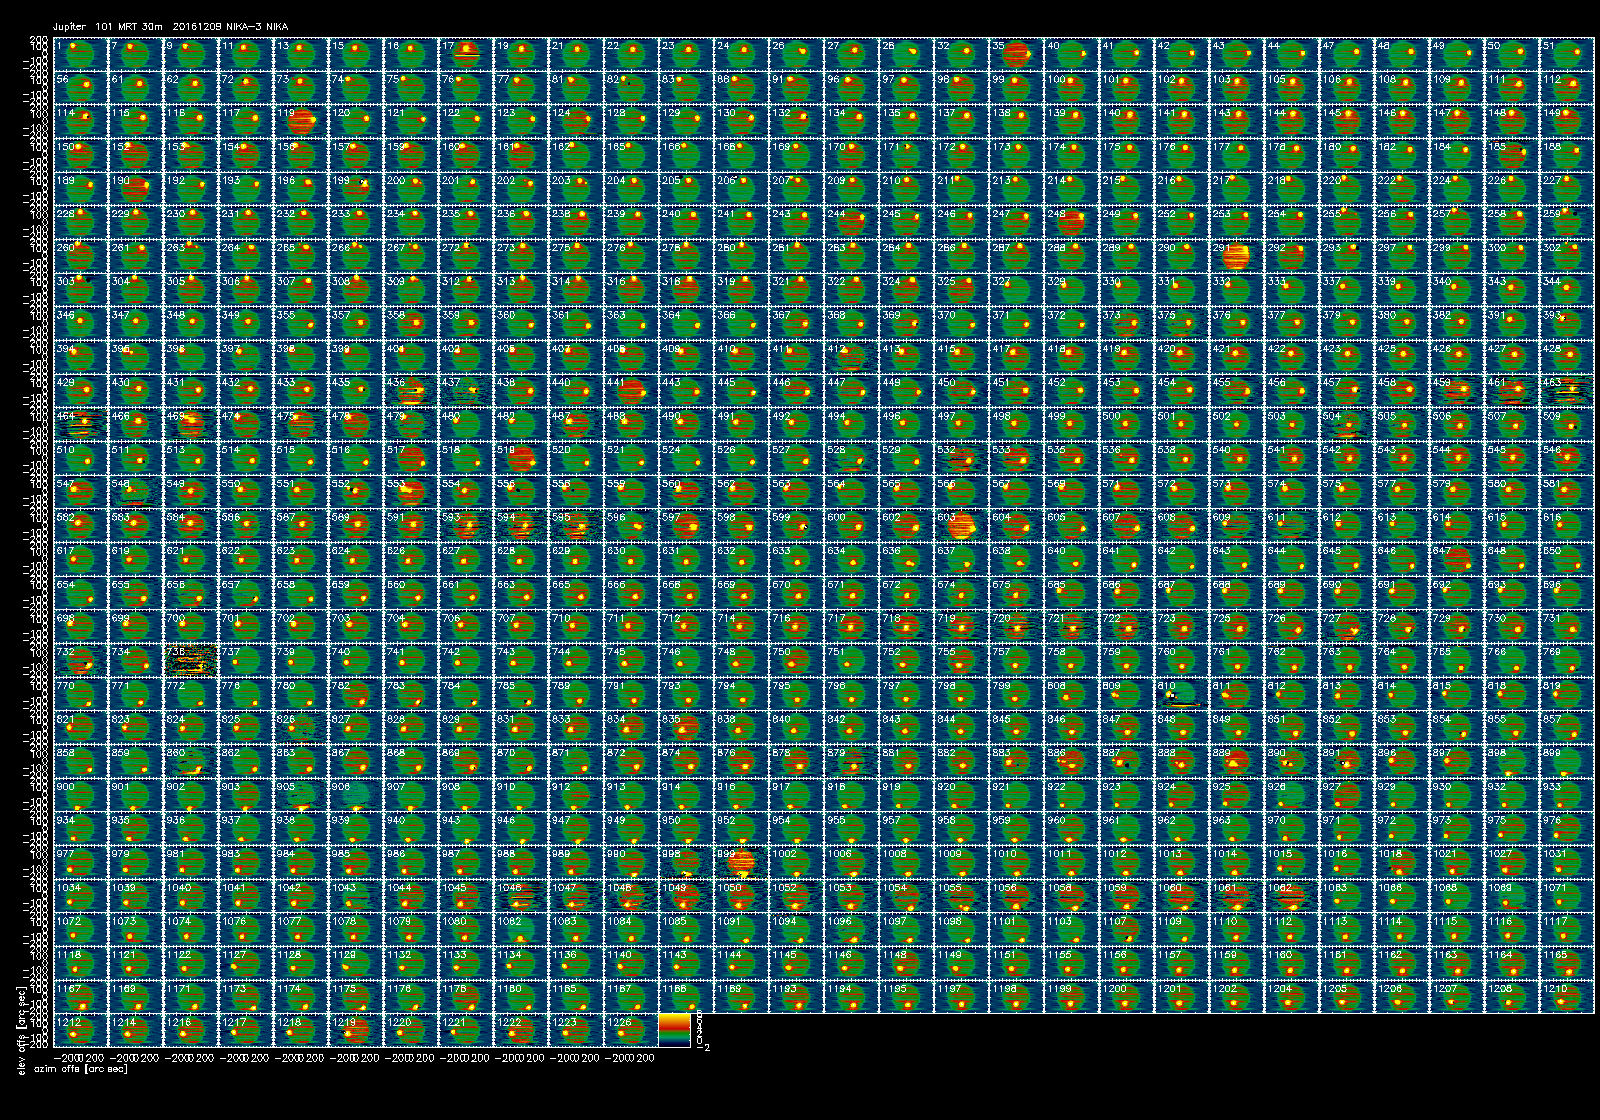
| The figure below shows the signal of the 2mm array (ar2) in % of Jupiter peak. | The figures below shows the signal of all arrays in % of the Jupiter peak. |
| Line 6: | Line 6: |
| {{attachment:Jupiter_NIKA-2-20161209s101.png||height=600}} | {{attachment:Jupiter_NIKA-2-20161209s101.png||height=900}} {{attachment:Jupiter_NIKA-1-20161209s101.png||height=900}} {{attachment:Jupiter_NIKA-3-20161209s101.png||height=900}} |
The "plateau".
The Jupiter map 20161209s101 allows to estimate the level of the "plateau". The figures below shows the signal of all arrays in % of the Jupiter peak.


