NIKA2 Run 6 Offline processing results
This private page is dedicated to results we get from a closer look to the raw data :
Calibrated Kidpar from the beammap 20161010s19 from the previous run
Using the beam map 20161010s19 (Uranus) from the the previous run (same configuration as the one we have now) we get the following KID positions after 2 iterations:
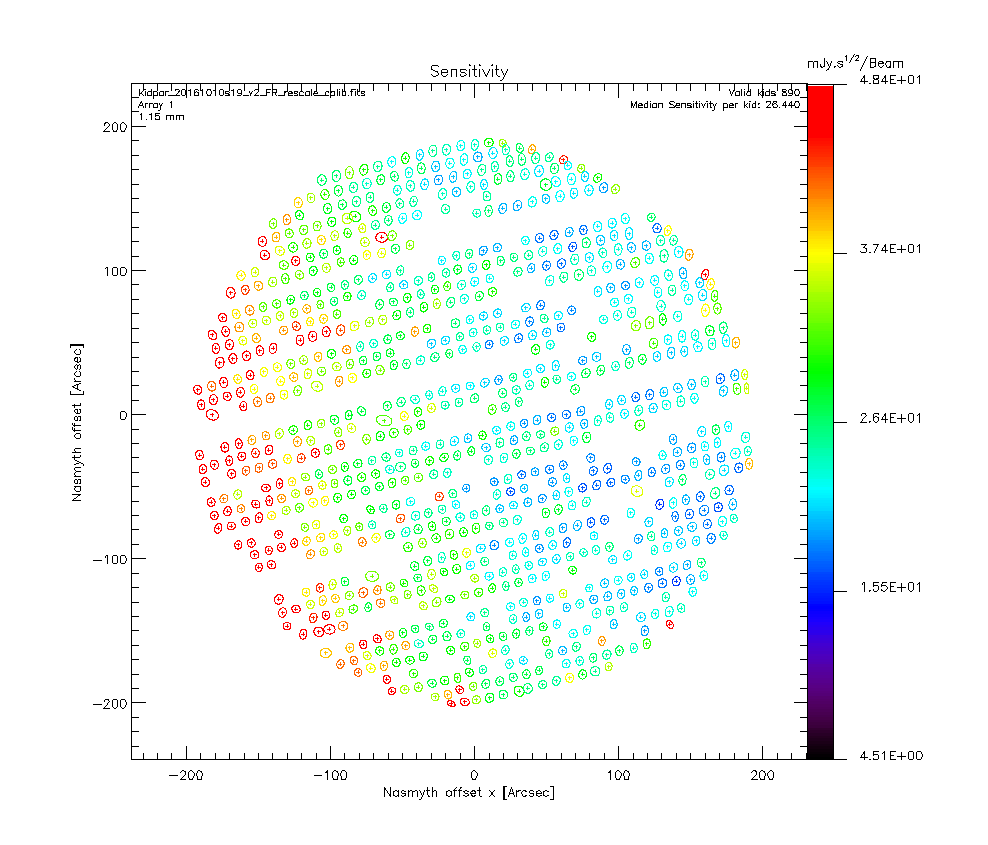
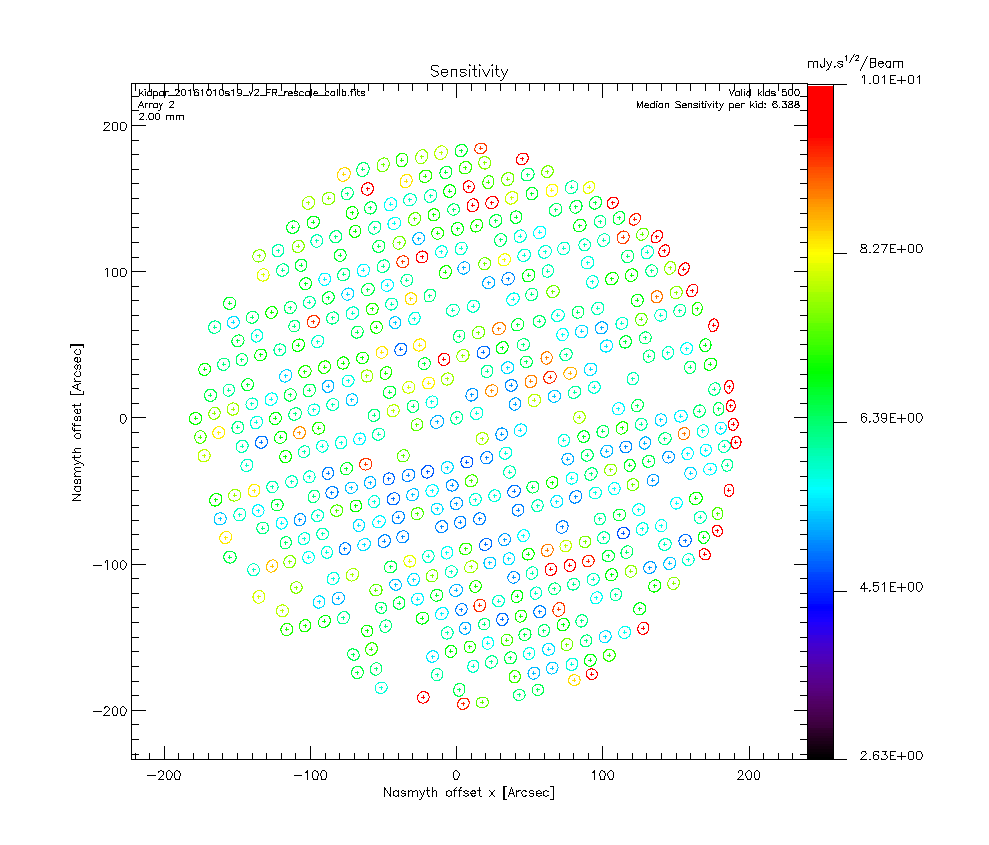
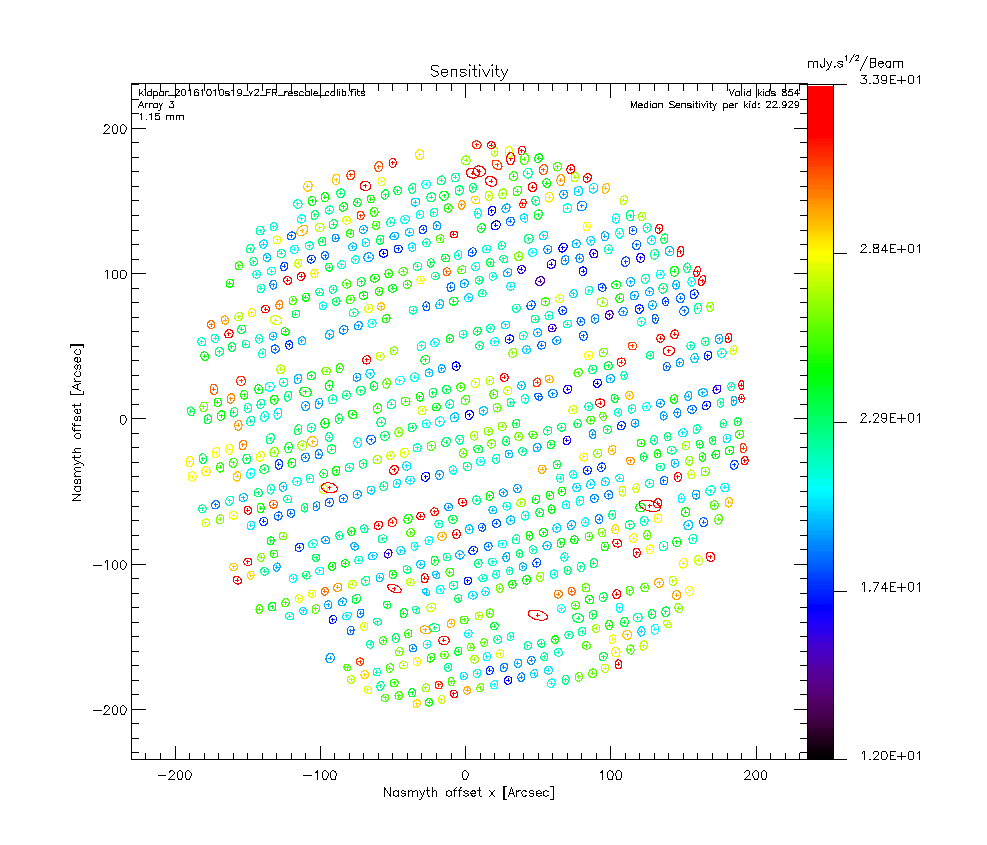
We use the skydip scan 20161026s115 of this run as it displays really good fits and the ratio tau_2mm/tau_1mm is around 0.65 as expected given the NIKA2 bandwidths. Therefore, the second iteration of the beammap processing takes into account opacity corrections which allows us to compute the KIDs calibration coefficients. The second step of the calibration coefficient computation consist in using the Kidpar and process several Uranus beammaps to get different measurements of its flux. We can then rescale the KID calibration coefficients so than the mean of the flux measurement distribution matches the expected Uranus fluxes at 1 and 2 mm. We use the beammaps 20161010s19, 20161010s37, 20161026s113, 20161026s114 as those are the only one we have on Uranus for this configuration. We get the following results:
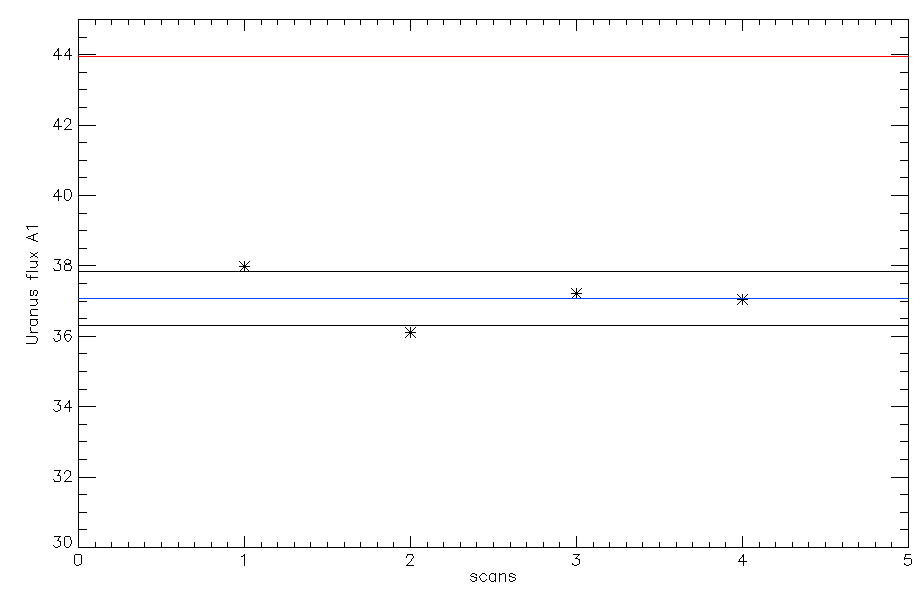
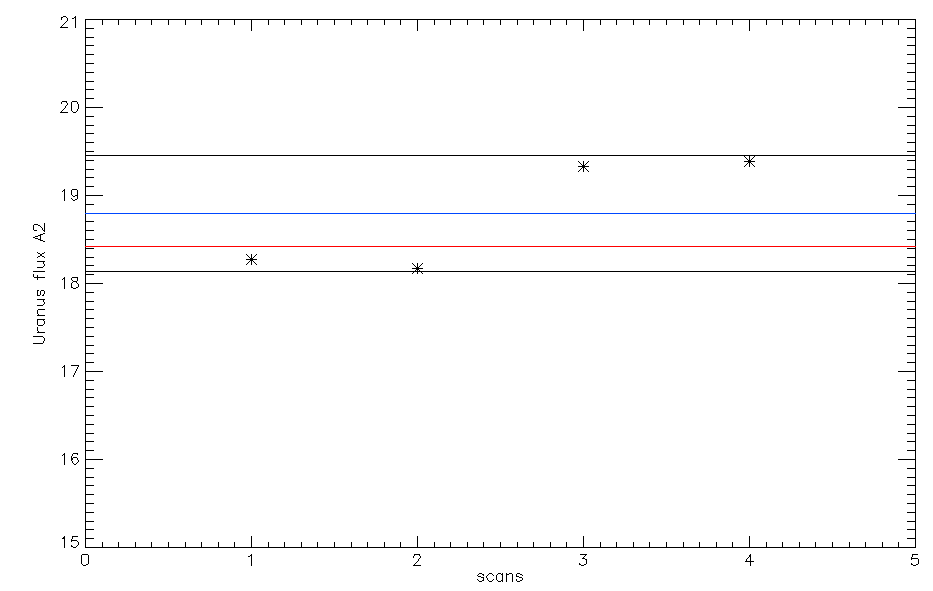
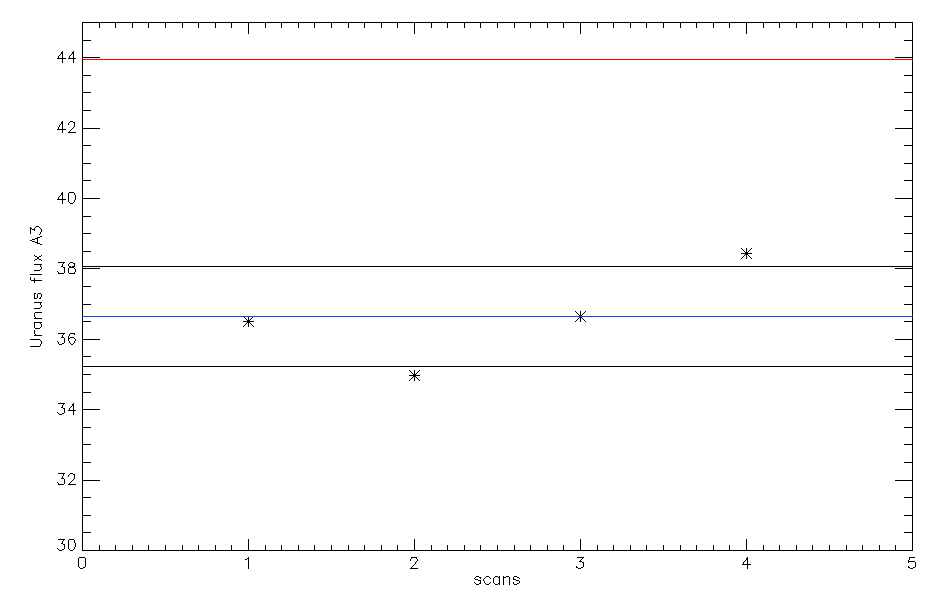
Ones the calibration coefficients are rescaled we can test this new Kidpar (kidpar_20161010s19_v2_FR_rescale_calib.fits) other sources to see if the measured fluxes matches the ones we expect. Using the beammaps we have on Neptune (20161026s80, 20161026s82) we get the following results:


We see that the measured fluxes (~17 Jy at 1 mm and ~7 Jy at 2 mm) are consistent with the expected fluxes of 16.54 and 6.93 Jy at 1 and 2 mm respectively. Therefore, the calibration coefficients seems correct to estimate the fluxes of the planets. We now test the calibration coefficients on a quasar. Using 2 beammaps on 3C84 (20161027s31, 20161027s32) and this new Kidpar, we get the following results:


Eventually, we consider weaker sources to test the calibration. Flux measurements on CRL618 using the scans 20161028s54 and 20161028s55:

Flux measurements on Vesta using the scans 20161028s62 and 20161028s63:

Florian Ruppin (28/10/2016)
FoV distortion from run5
Skydip analysis
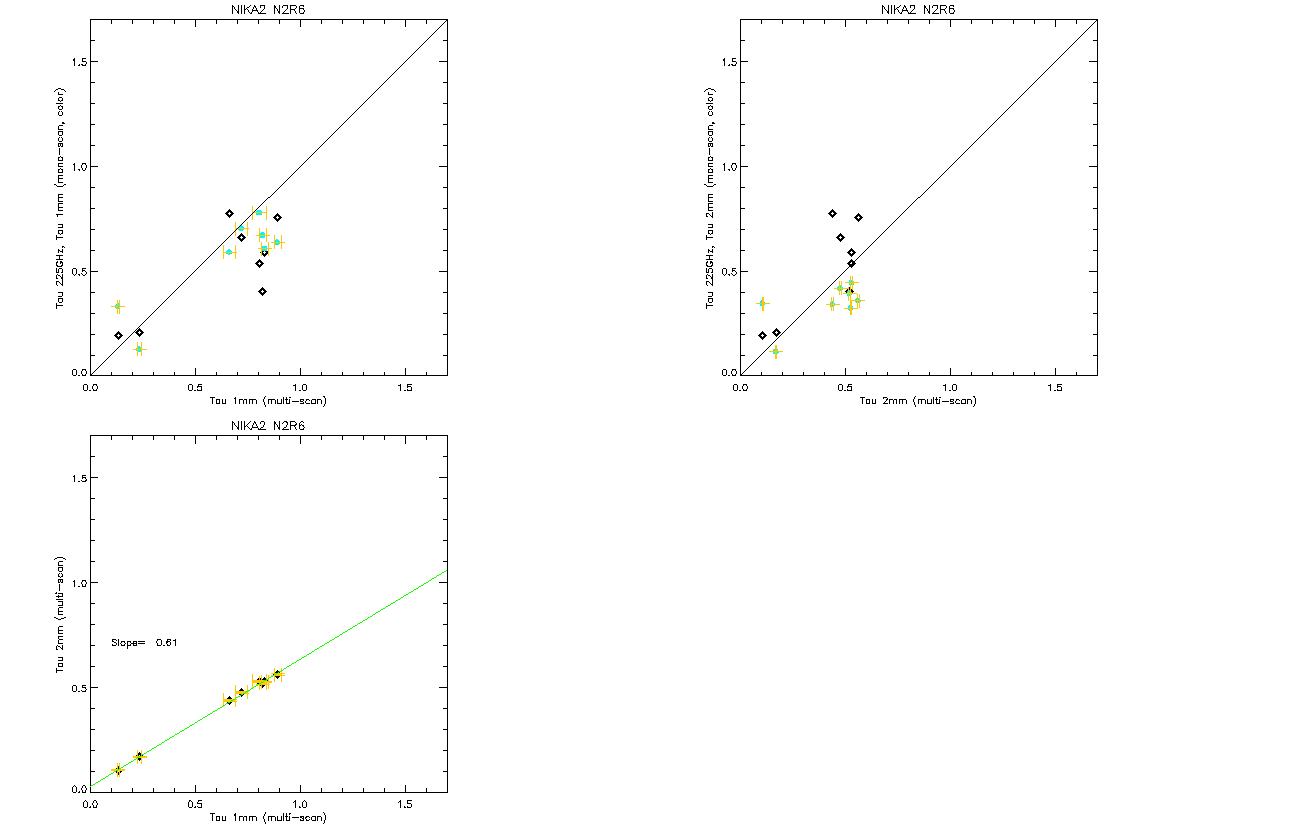
FXD: Following the multi-scan analysis [http://www.iram.fr/wiki/nika2/index.php/April_12th,_2016,_FXD,_a_multi-scan_method_to_analyse_skydip_measurements], here are the figures for the 2 skydips of the 10th October 2016
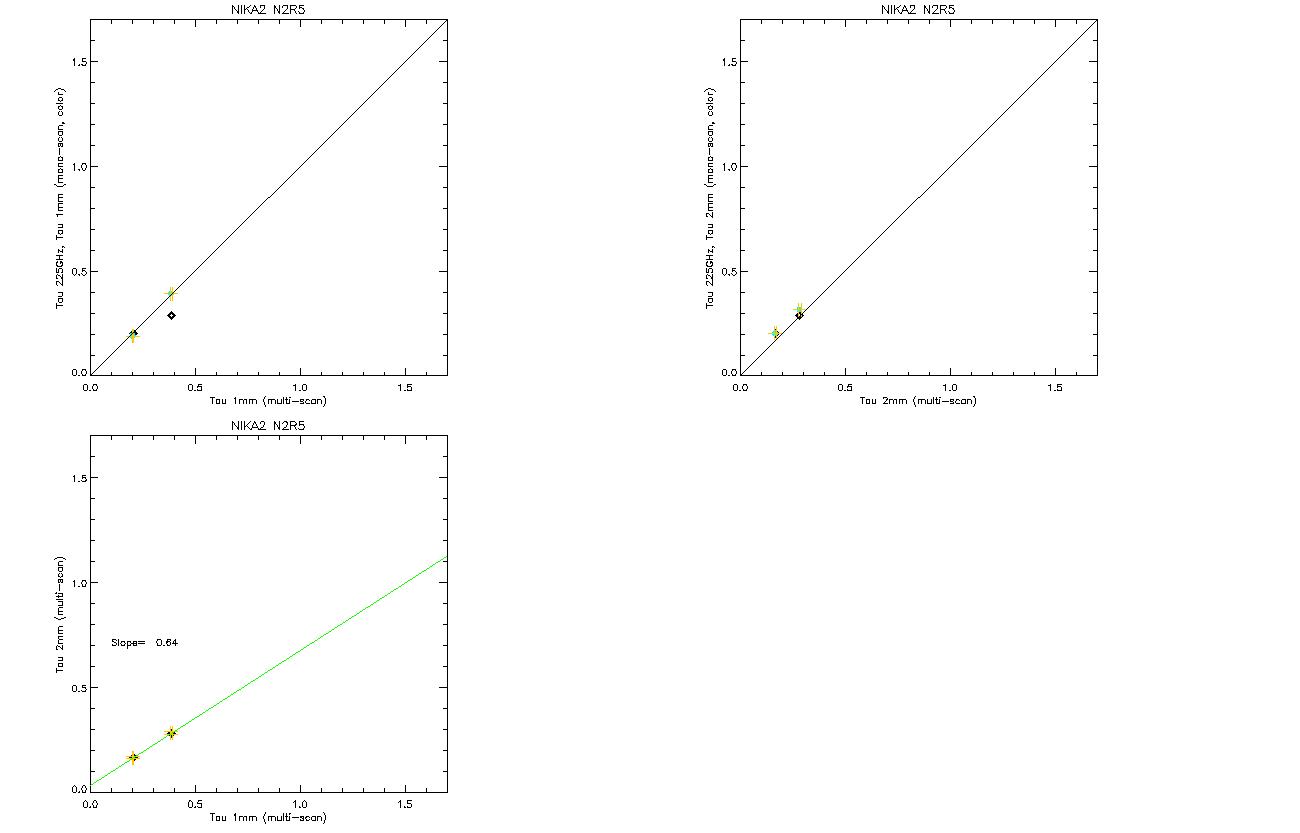
The plot shows that we recover the expected ratio of 0.65 between the opacity at 2mm and 1.2mm.
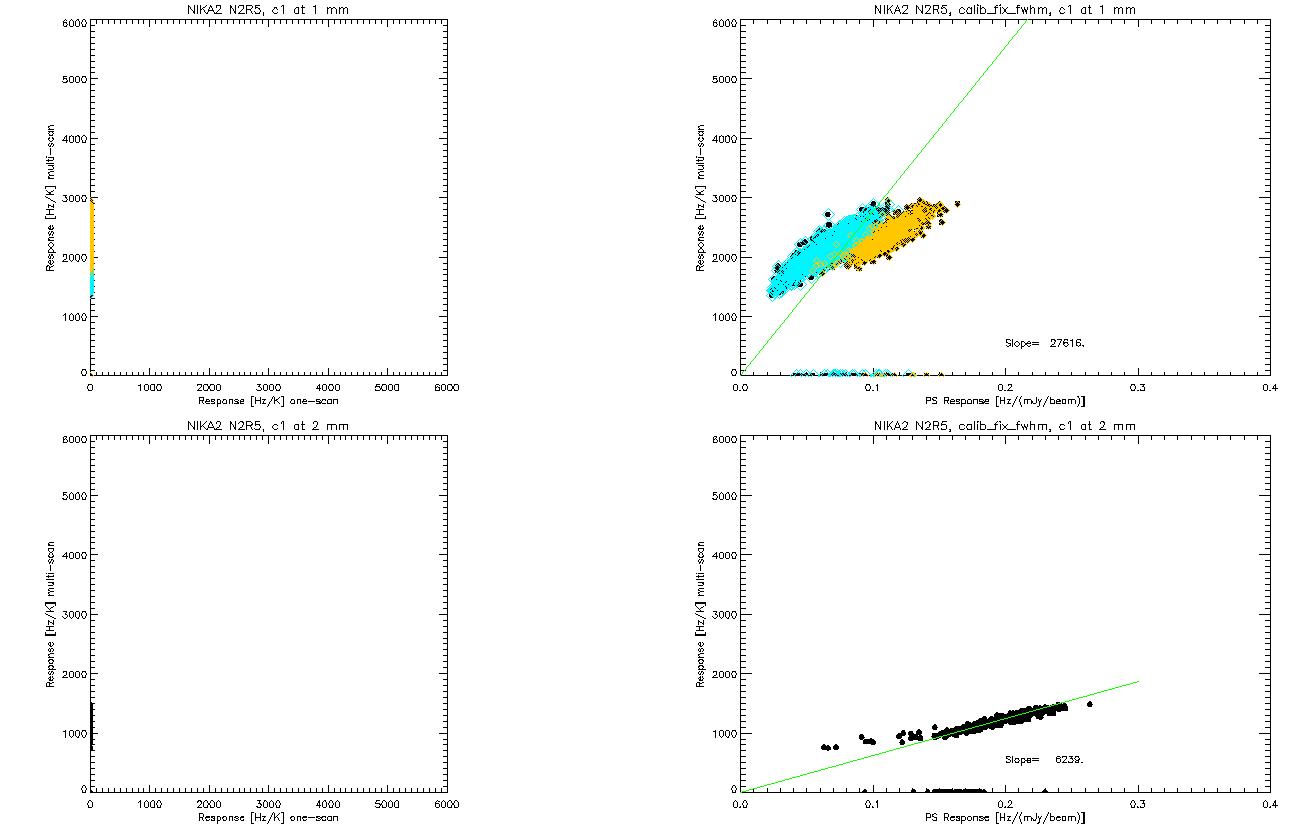
The other plot displays (on the right) the extended source sensitivity (established with the 2 skydips) vs. the PS sensitivity (established on Uranus). Note that the correlation is linear and goes through zero for the 2mm array whereas the 1mm arrays (blue and yellow) show a (too) wide range of PS sensitivities. This issue has been raised several times now.
Here is the update with 8 skydips taken during this run 6 only. The ratio of tau2mm/tau1mm is 0.61. The two opacities (at 1 and 2mm) follow each other accurately. The 225GHz taumeter shows more fluctuations but is still a good quick indicator of the atmosphere. New kidpar with updated c0 and C1 can be found on svn: Kidpars/kidpar_20161010s37_v3_skd8_match_calib_NP_recal.fits

Map-making test on Orion KL: impact of an inaccurate intercalibration of the detectors
Orion KL was observed on 20161028 (scans 58 and 59) through high opacity (~0.6 to 0.7).
The data were reduced up to "level 1" (i.e. flux calibration and opacity correction) with the pipeline, using the most up-to-date kidpar (kidpar_20161010s37_v3_skd_match_calib_NP_recal.fits), and then up to "level 2" (i.e. atmosphere and noise subtraction, and projection) with scanam_nika (adapted from Scanamorphos for Herschel).
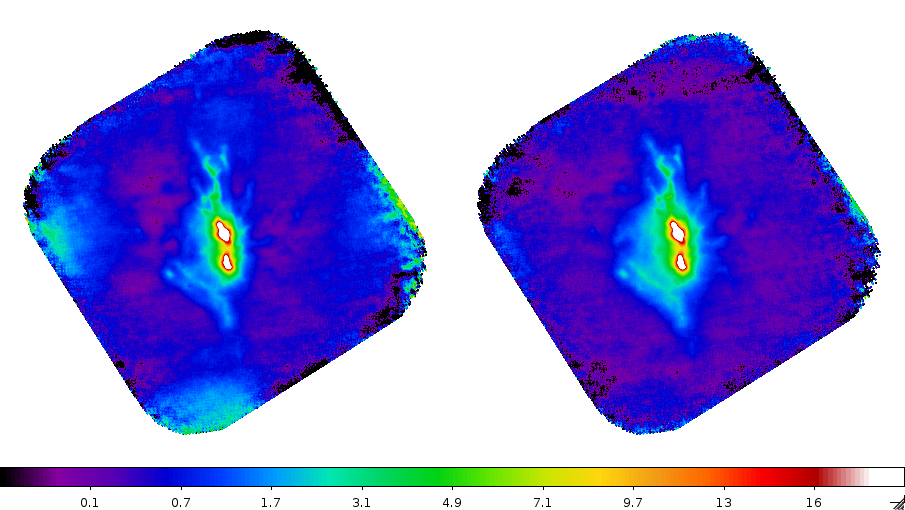
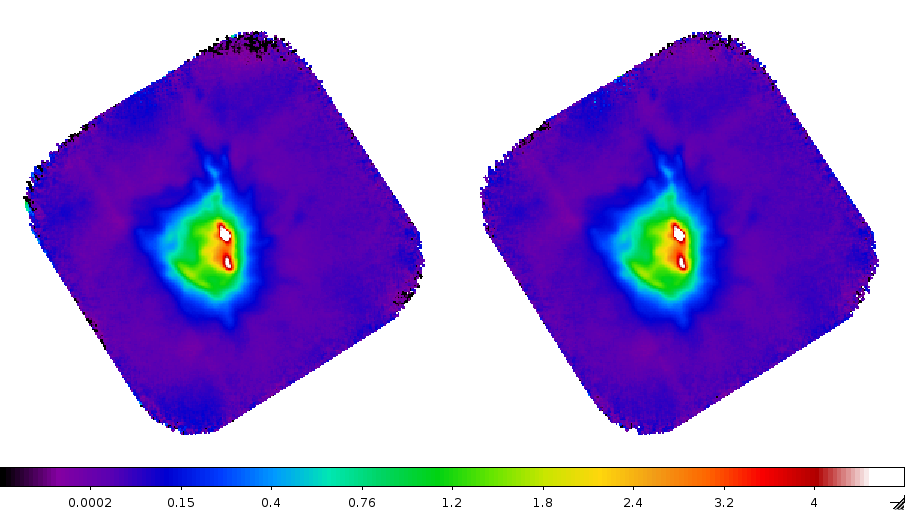
Two versions were produced: the first with the default point-source calibration (left panel in the plots below), and the second with a first-order extended-source calibration (right panel in the plots), that does not change the global response of the combined arrays 1 and 3 at 1mm nor the global response of array 2 at 2mm, but that changes the relative responses of the individual detectors. Ideally, the relative gains of the detectors should be derived from an analysis of all long scans of run 19, but for the time being they are derived only from the two Orion KL scans themselves.
The plots below show that: at 2mm, the two versions of the map are very similar ; but at 1mm, the second version is much better (less residual correlated noise, diffuse emission more faithfully restored) than the first. This is because errors on the multiplicative effects (responses of the detectors) have a large impact on the additive effects corrected afterwards (low-frequency noise subtraction).
HR, Oct. 29
result at 1mm (square root scale, high cut applied):
result at 2mm (square root scale, high cut applied):
Beam shape study using beammaps of this run
A first beam shape study has been performed using the beammaps we made on Uranus during this run (for bad opacities ~0.7). The list of scan we consider is the following: ['20161026s113', '20161026s114', '20161027s216', '20161027s217', '20161027s239', '20161027s240', '20161029s312', '20161030s7']
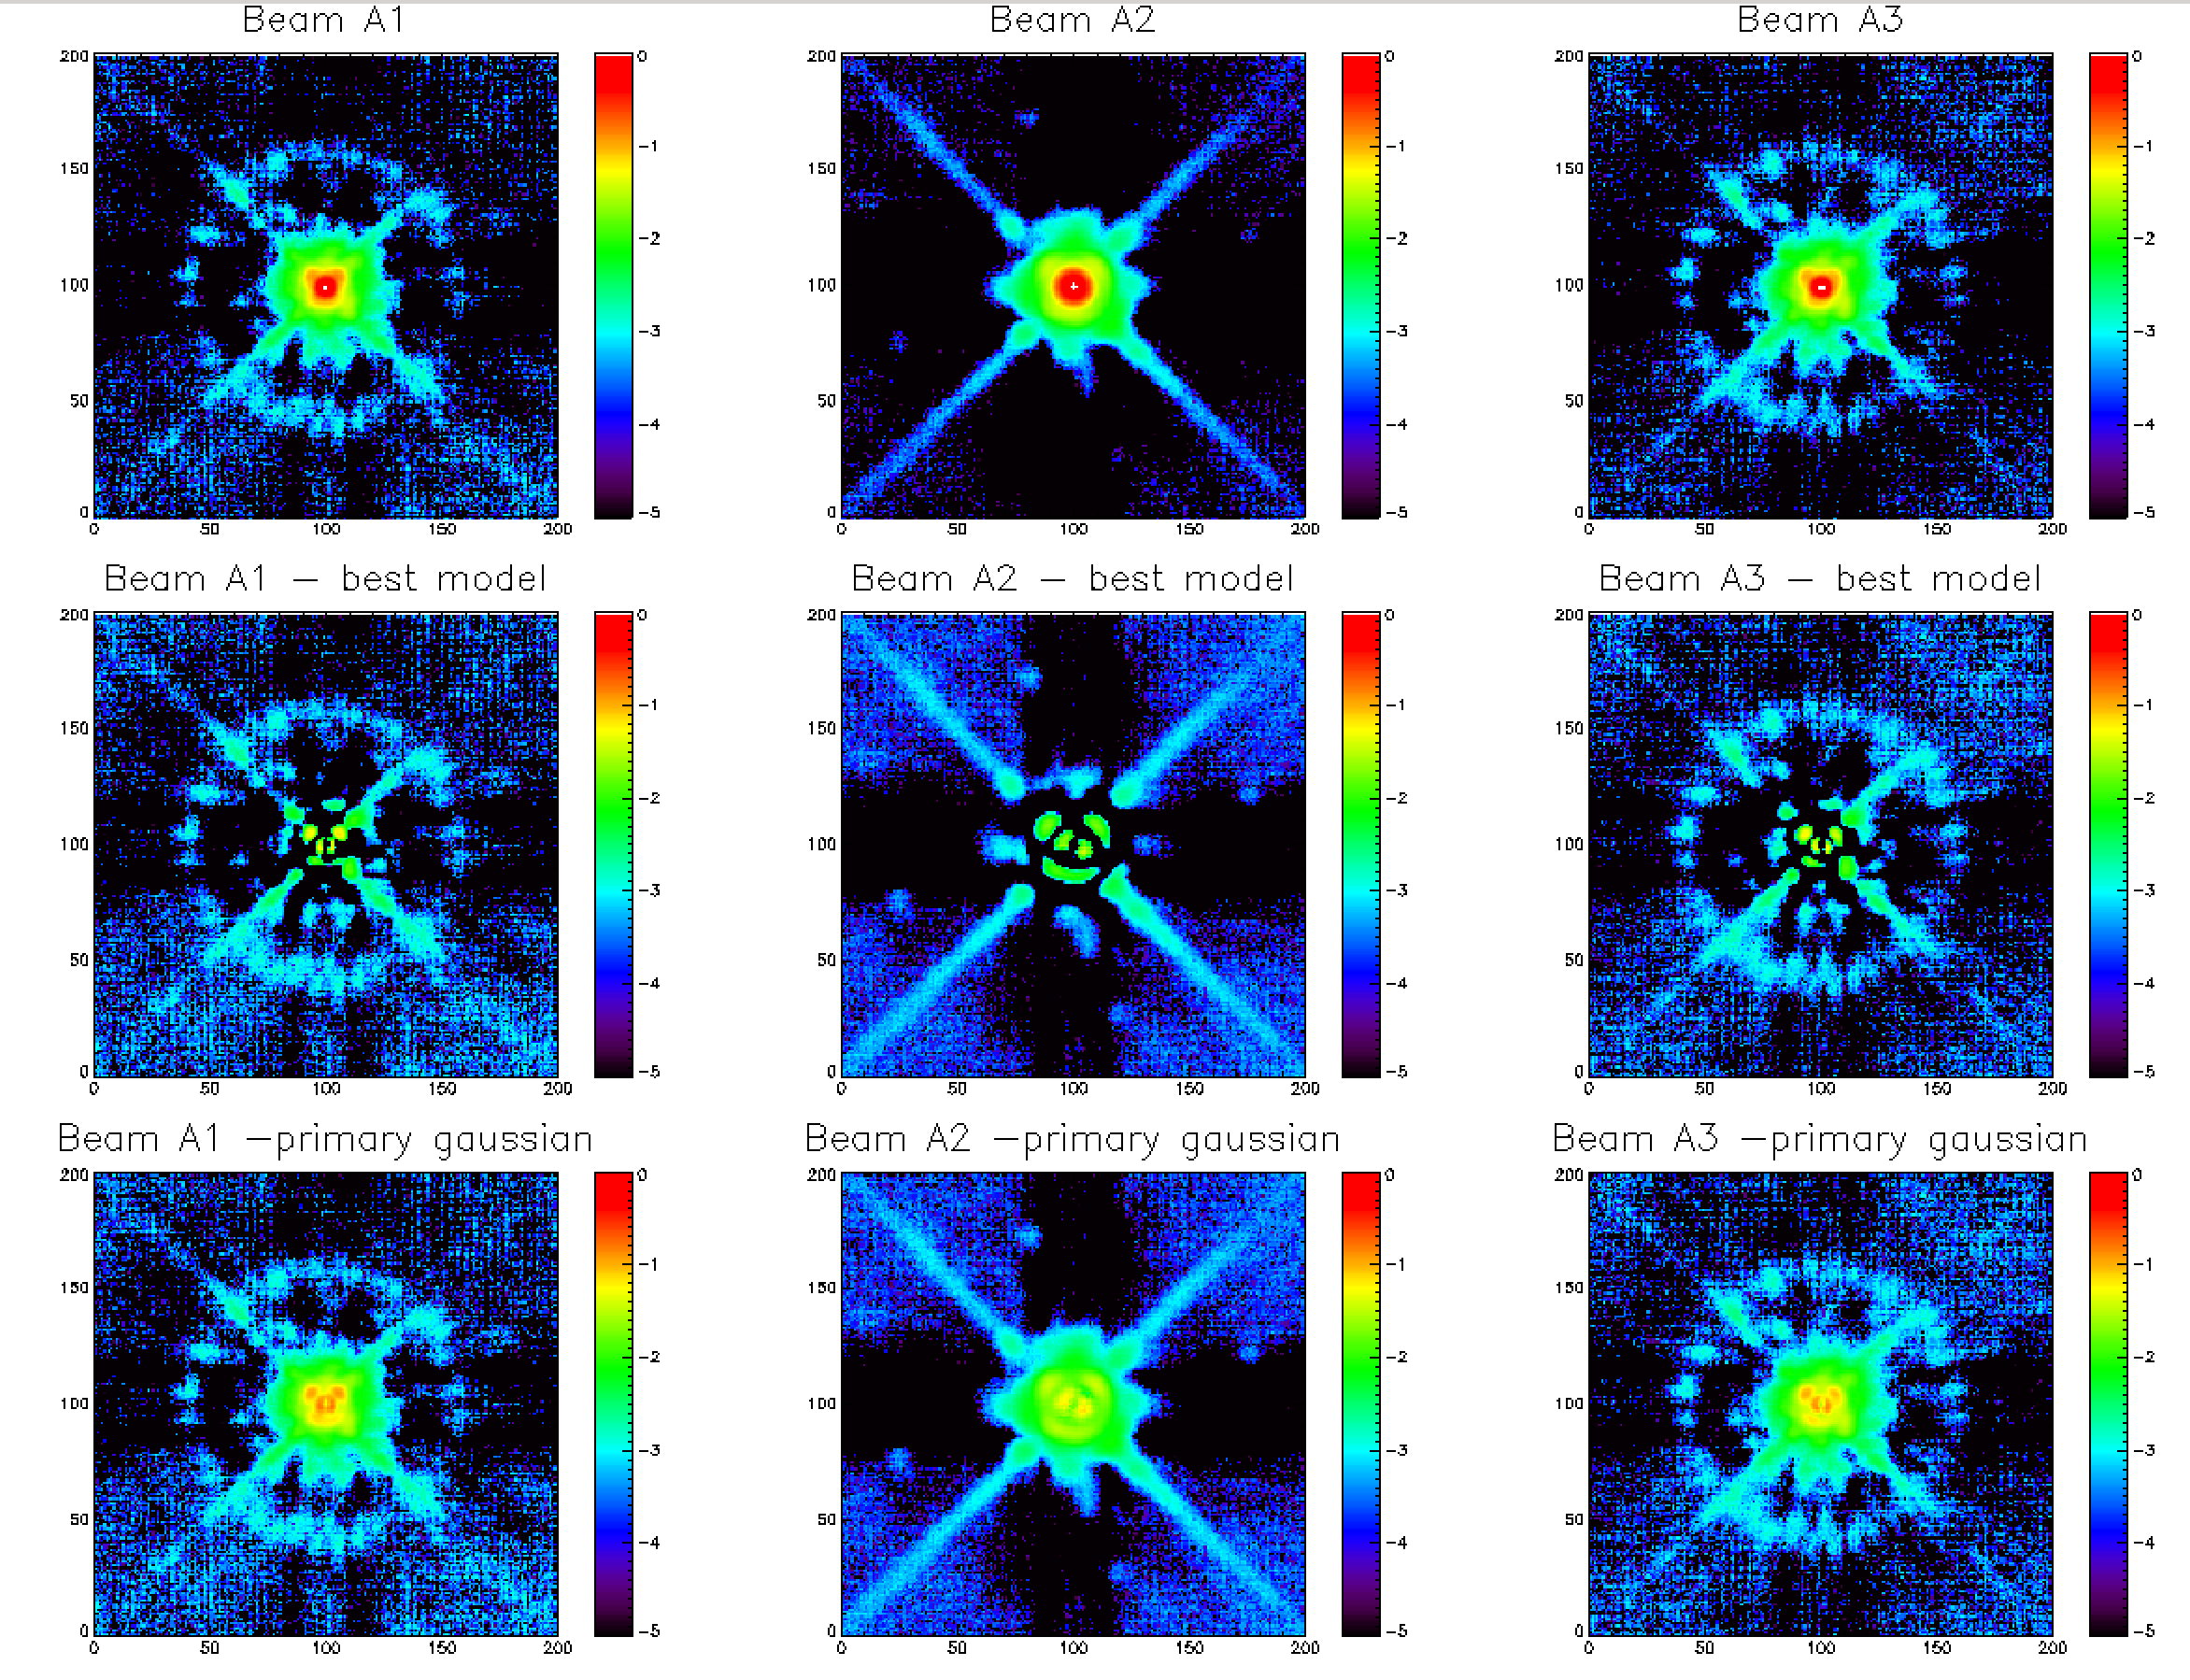
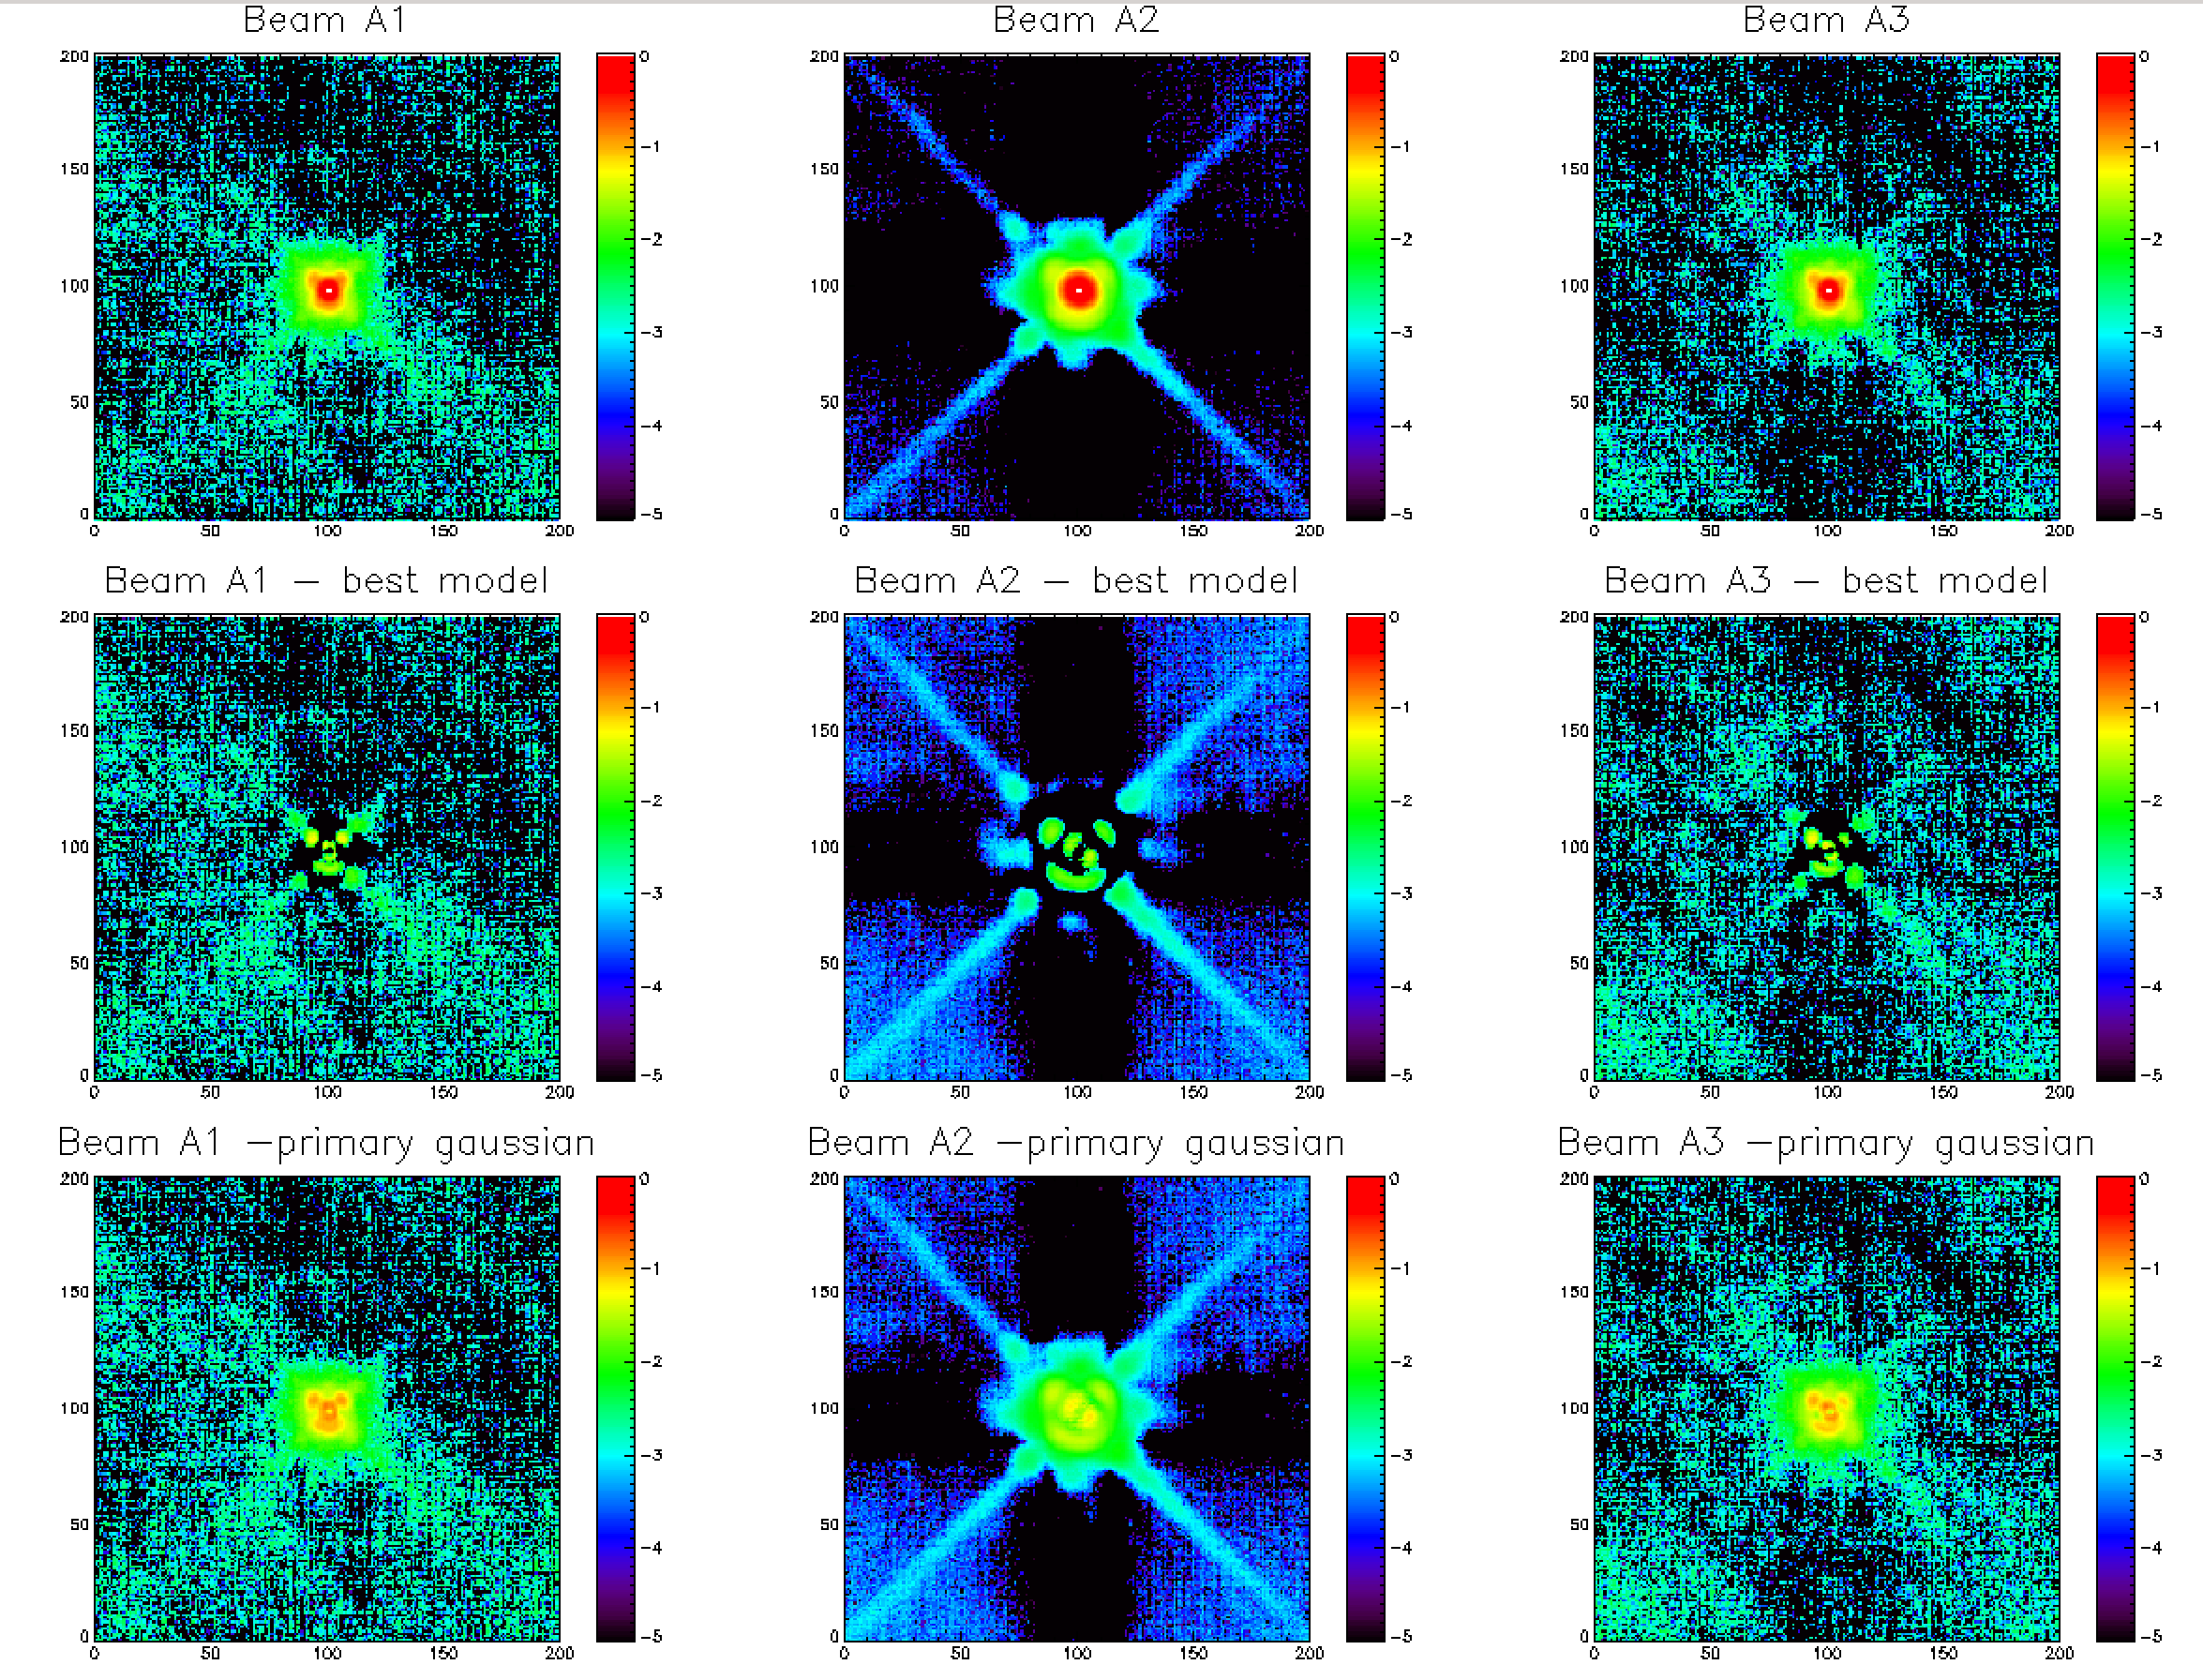
We process these scans using the kidpar discribed at the top of this page (kidpar_20161010s19_v2_FR_rescale_calib.fits) and then perform a coaddition of the individual scans (projected in the AzEl coordinate system) to get a better signal to noise ratio far from the primary beam. The top line of the left panel of the figure below displays the final maps we get for array 1, 2 and 3 in log scale after a renormalization of the amplitudes to 1. We see that for array 1 and 3 the strong Uranus flux (~40 Jy) allows us to highlight the expected ring pattern at about 100" from the beam center. We also start to distinguish the tetrapod arms on the array 2 map.
For this first study, we decide to model the NIKA2 beam by a combination of 3 Gaussians centered on the same position with different amplitudes and widths. Therefore, the fitted parameters are the 3 Gaussian amplitudes, the 3 Gaussians FWHM, 2 coordinates for the position and the zero level of the map (9 parameters). The best fit models of the Uranus final maps discribed above are then subtracted to the data to get the maps on the second line of the left panel of the figure below. We can therefore see that most of the beam structures are well discribed by this model as the residual is at the percent level.
If we decide to subtract only the primary beam and the zero level to the data (the primary beam is given here by the Gaussian of highest amplitude and lowest FWHM in the best-fit model), we get the maps of the third line of the left panel of the figure below. Such maps give us an estimate of the side lobes structures.
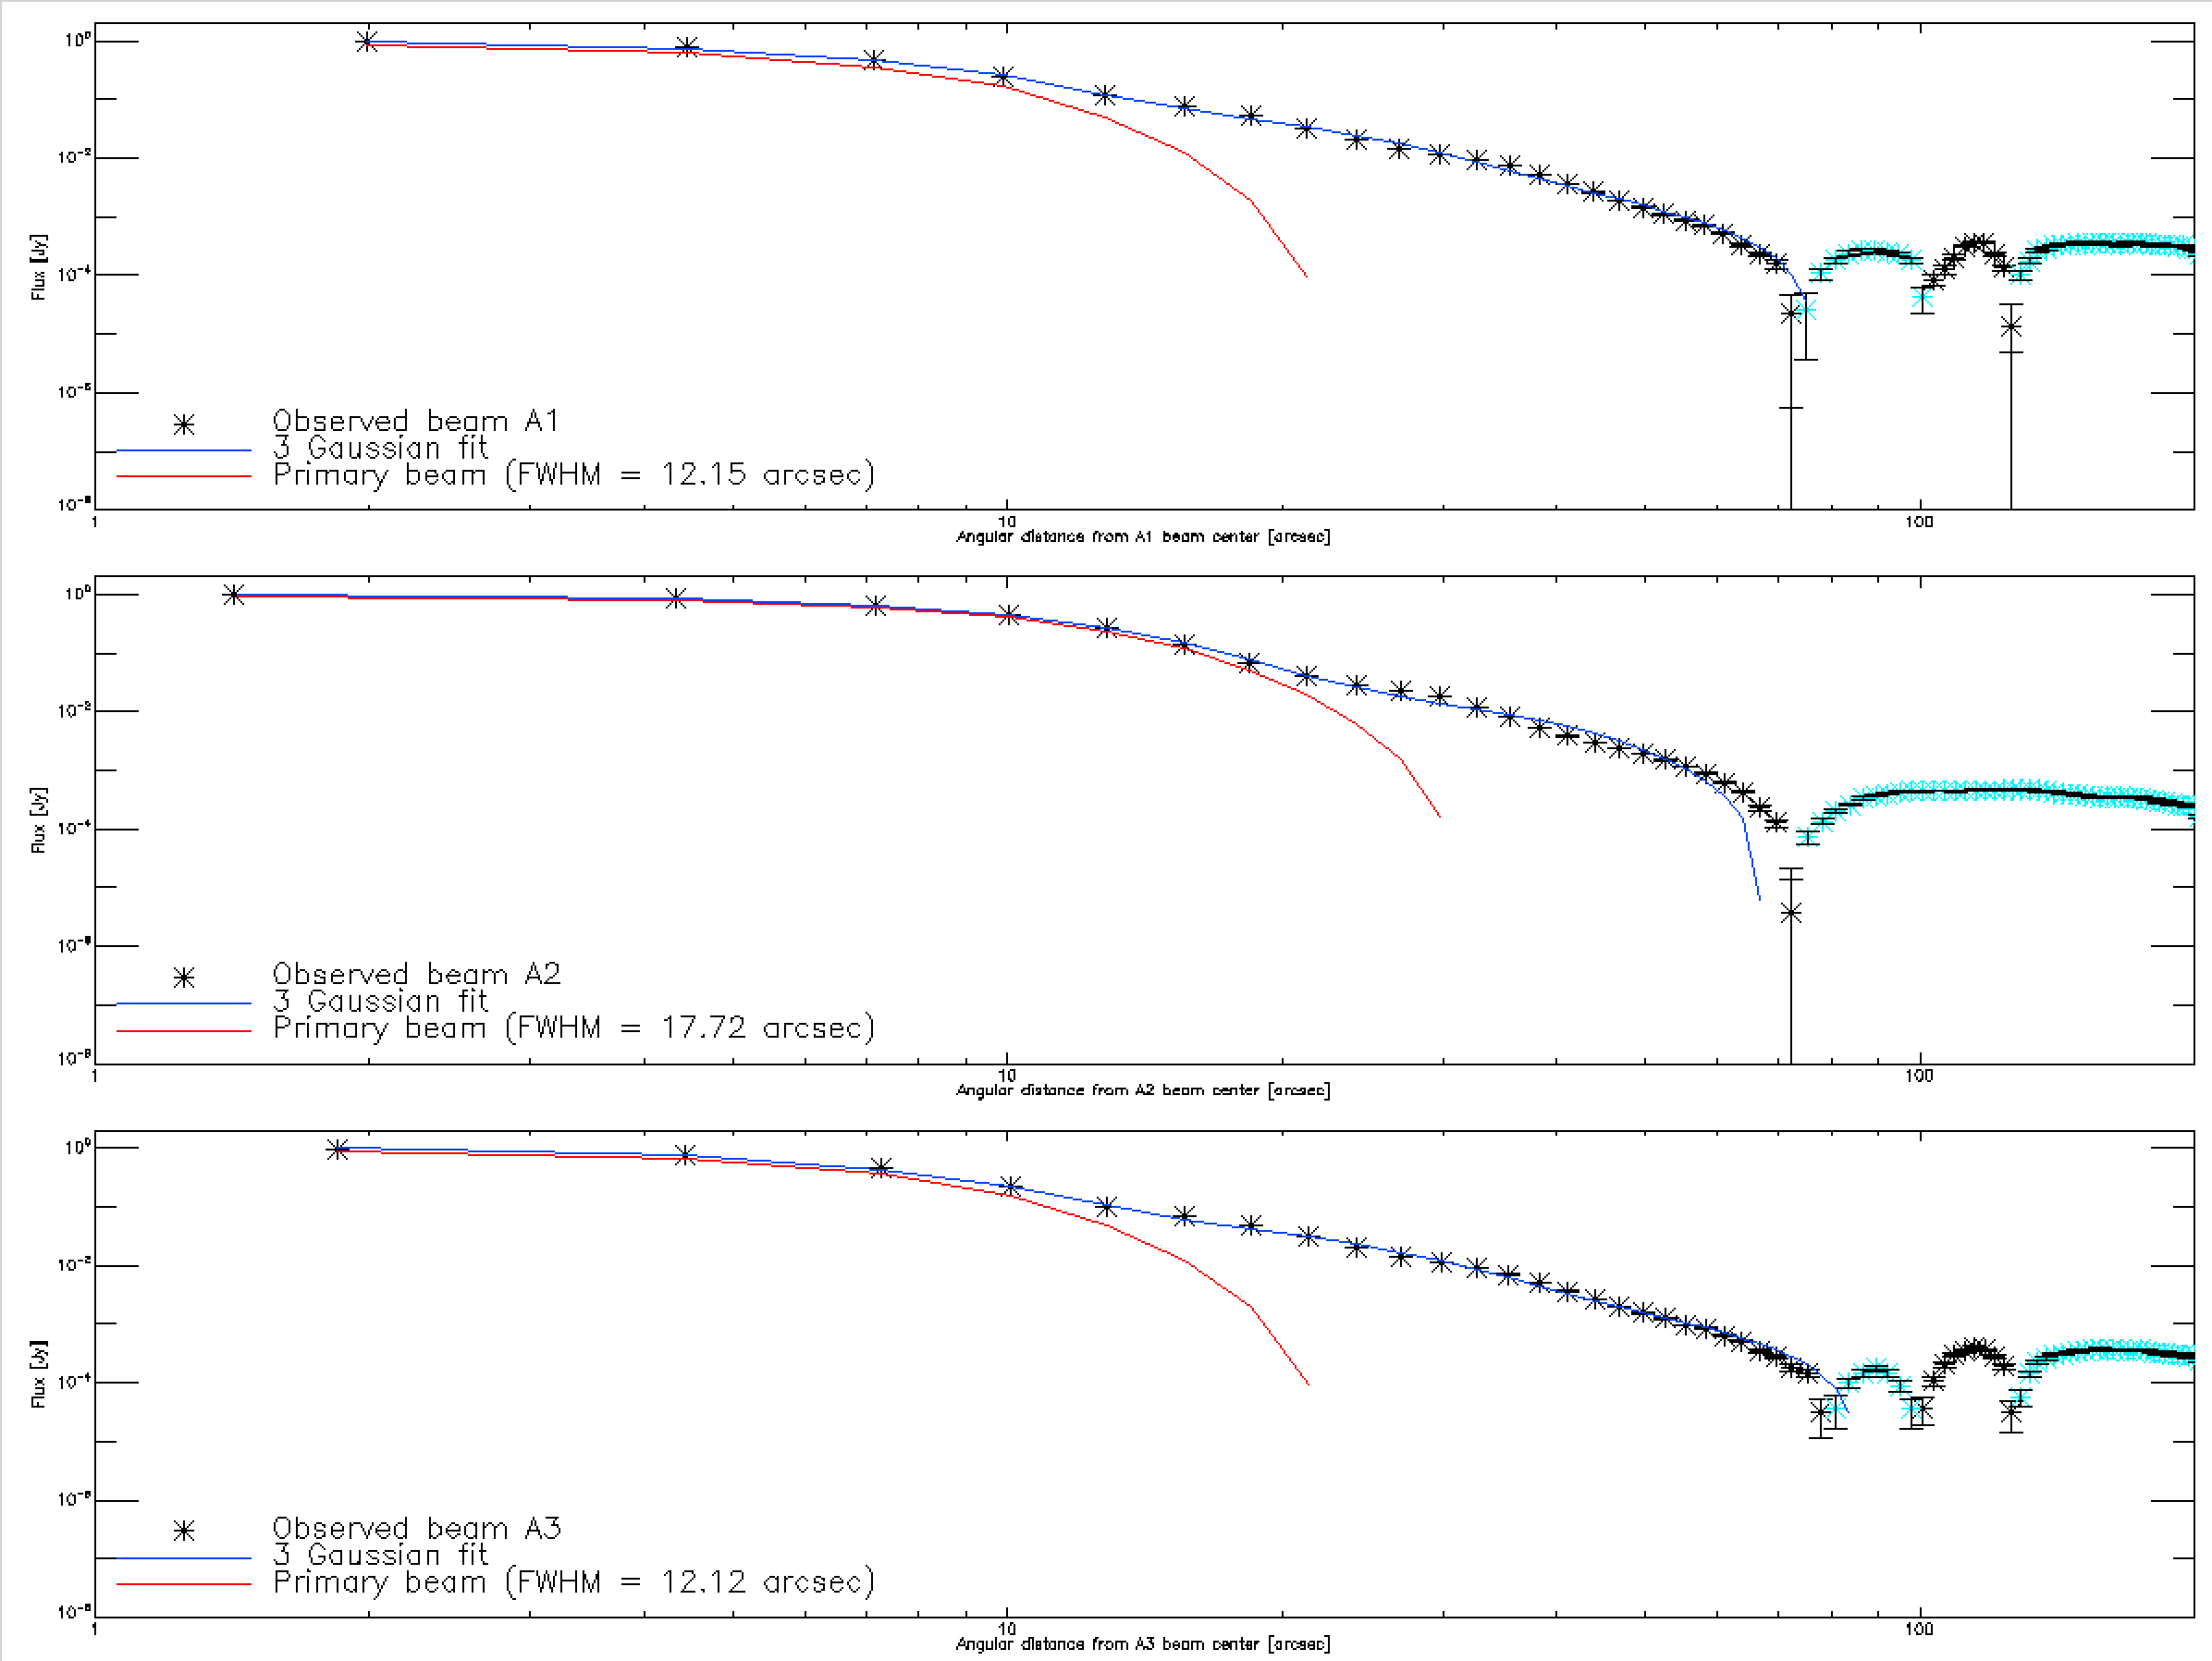
By computing the profiles of the data maps and best-fit model maps, we get the 3 graphs of the right panel of the figure below. The data points are shown in black, the 3 Gaussian fit best model in blue and the primary beam (Gaussian of highest amplitude and lowest FWHM) in red. We see again on this figure that the 3 Gaussian beam model is well adapted to discribe the NIKA2 beams at 1 and 2 mm up to ~70" from the beam center. The cyan points correspond to negative points for which the sign as been changed so we can see them in this log scale graph. The small bump at ~100" for the array 1 and 3 beams correspond to the ring pattern identified on the maps. For this list of beammaps, the primary beams display a FWHM of 12.1" and 17.7" at 1 and 2 mm respectively.
Fitting 3 Gaussians gives for the Main Beam smaller size than just one Gaussian fit. The small FWHM found at 2 mm is therefore expected. We could however expect a better FWHM at 1 mm. This study will have to be repeated using beammaps taken with better weather conditions.
Fitting 3 Gaussians gives for the Main Beam smaller size than just one Gaussian fit, therefore the 12.6" for the FWHM of the MB is a very high value ! The Quick Look processing gives much lower values - around 11.5". The beam analysis must be performed in horizontal system, but it seems that the tetrapod does not appear as diagonals in the figures. In what coordinate system is this analysis performed ? RZ 30/10/2016
--> The analysis has been done again by projecting in AzEl coordinates and the FWHM at 1 mm is now closer to the Quick Look value. FR 30/10/2016
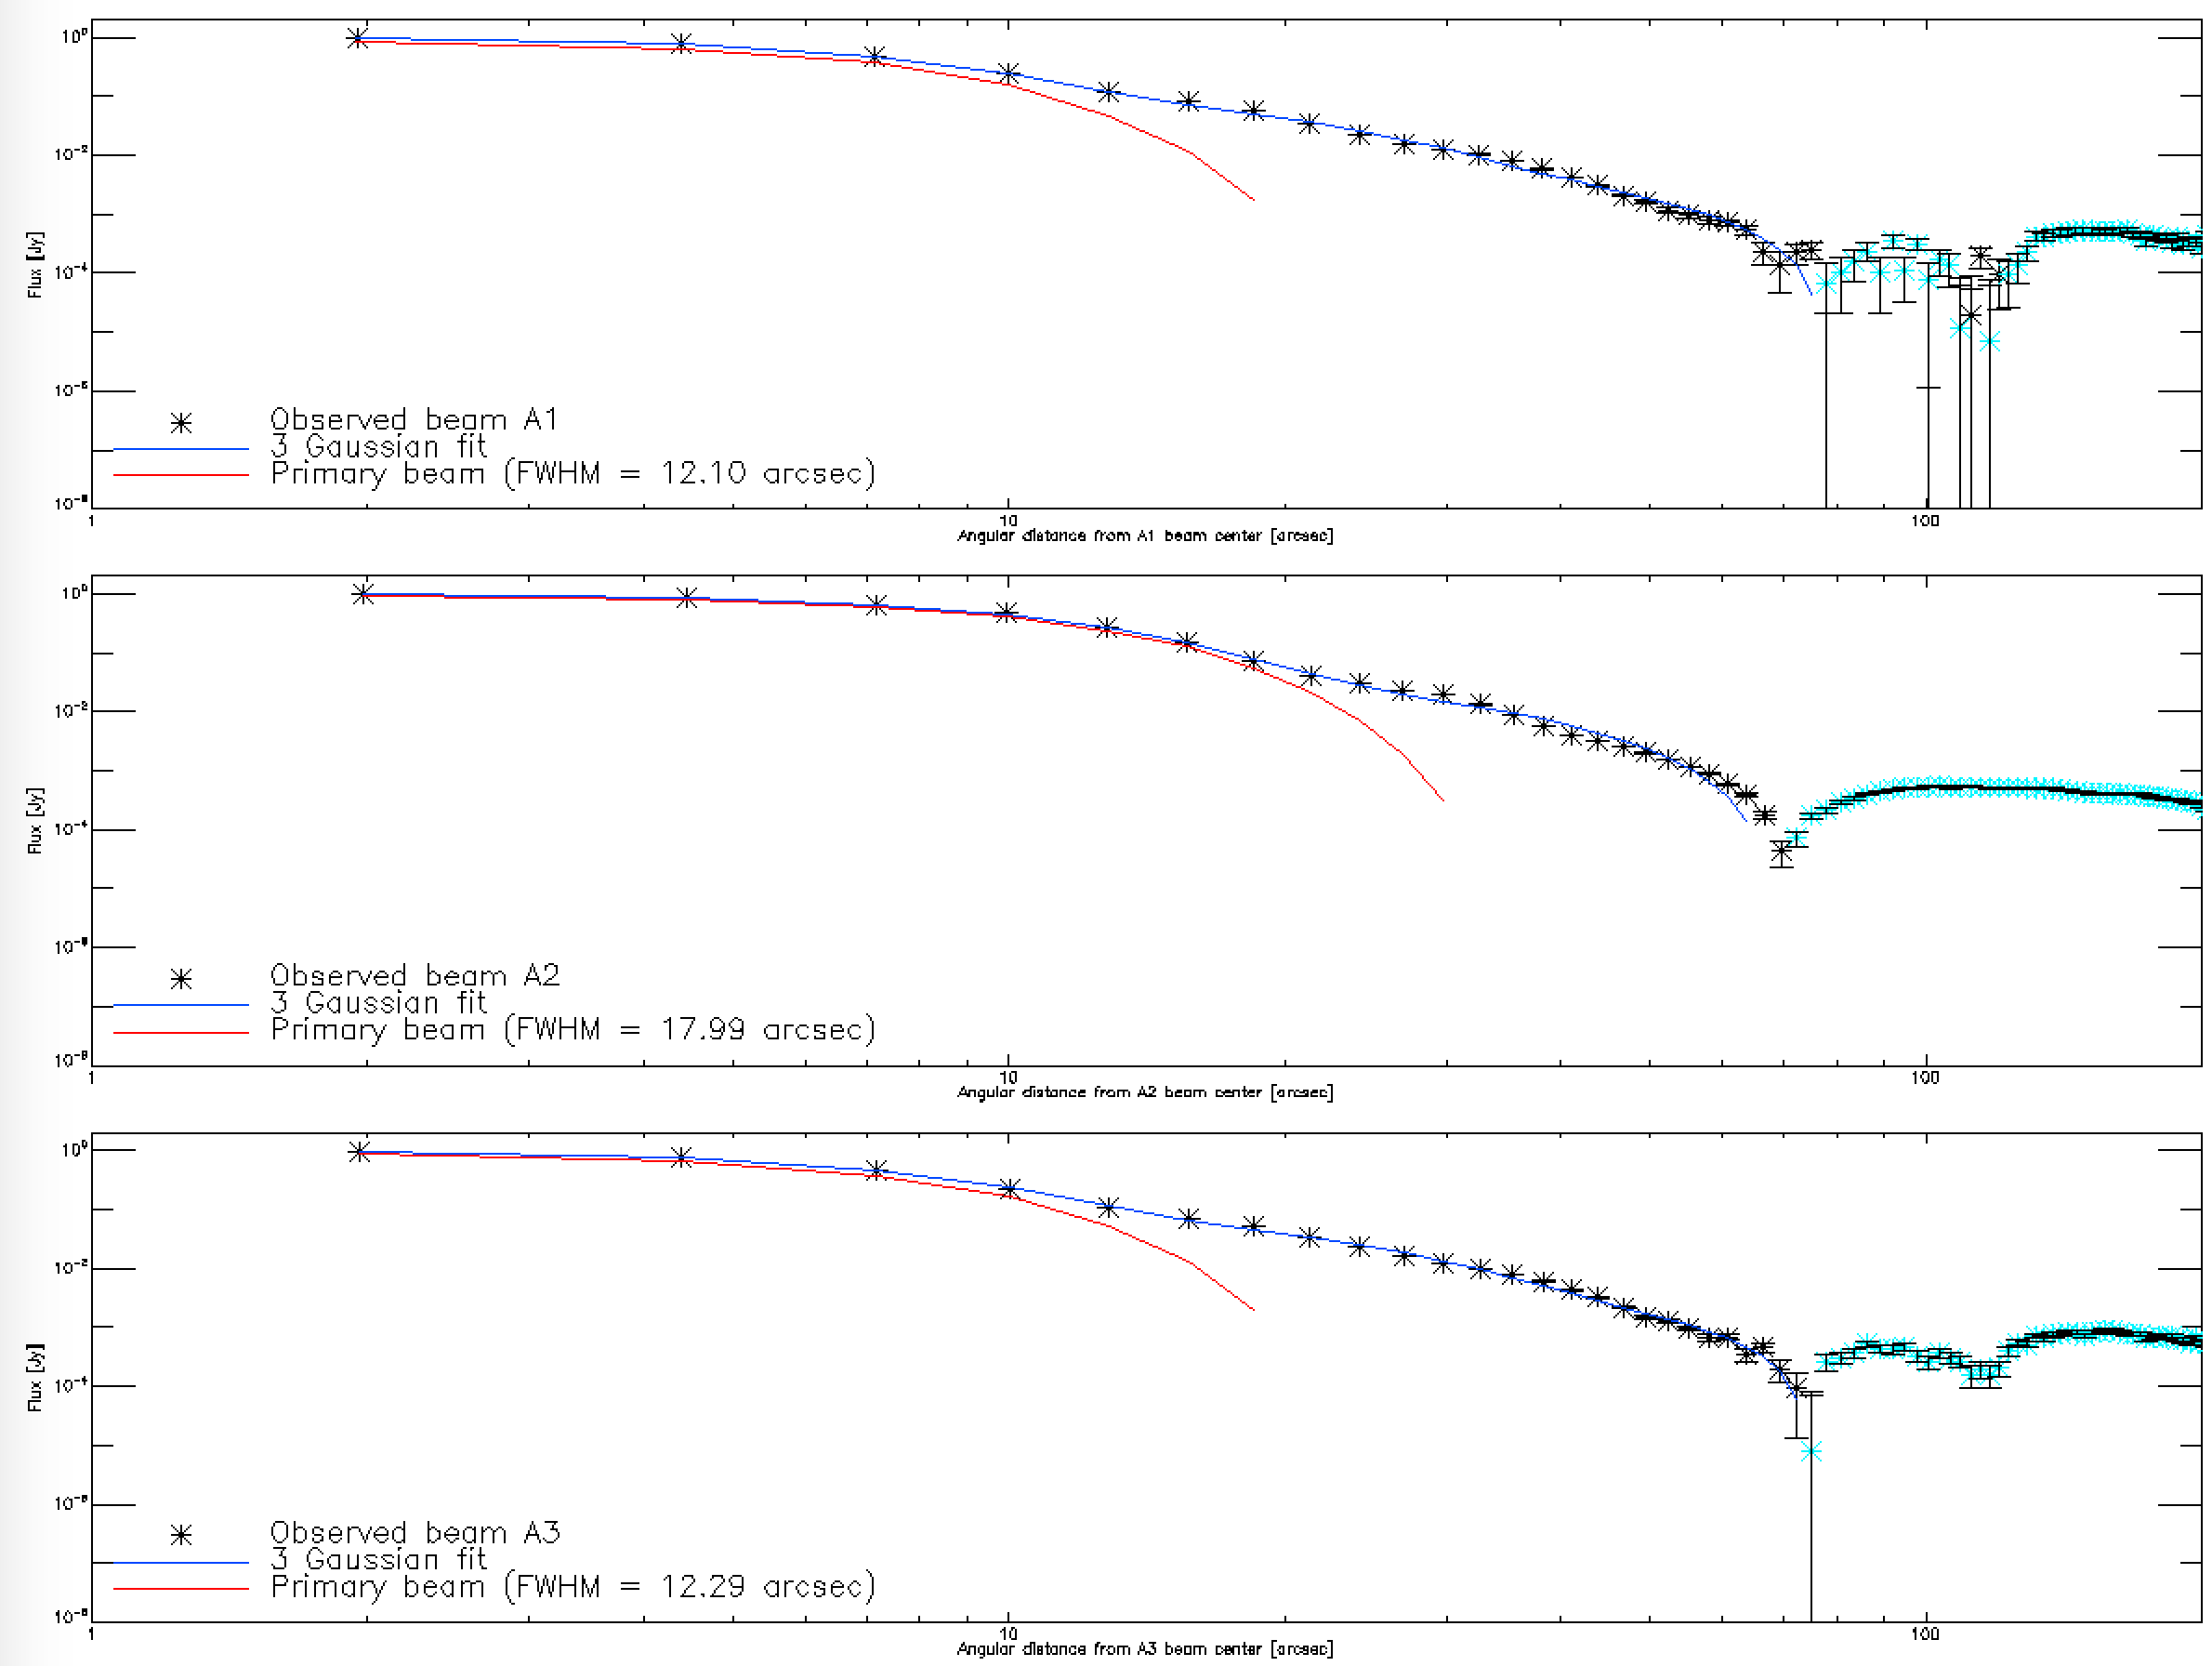
The same study has also been performed using the beammaps of the quasar 3C84. The list of scans which has been considered is the following: ['20161027s22','20161027s30','20161027s31','20161027s32','20161027s33','20161027s34','20161027s35','20161028s42','20161028s44','20161028s48','20161028s50','20161029s37']
The results we obtain are similar even though the signal to noise at 1 mm is decreased by a factor 4 (see figure below). This gives us confidence on the results derived in this study (which will have to be done again using better beammaps at lower opacities).
Florian Ruppin (30/10/2016)
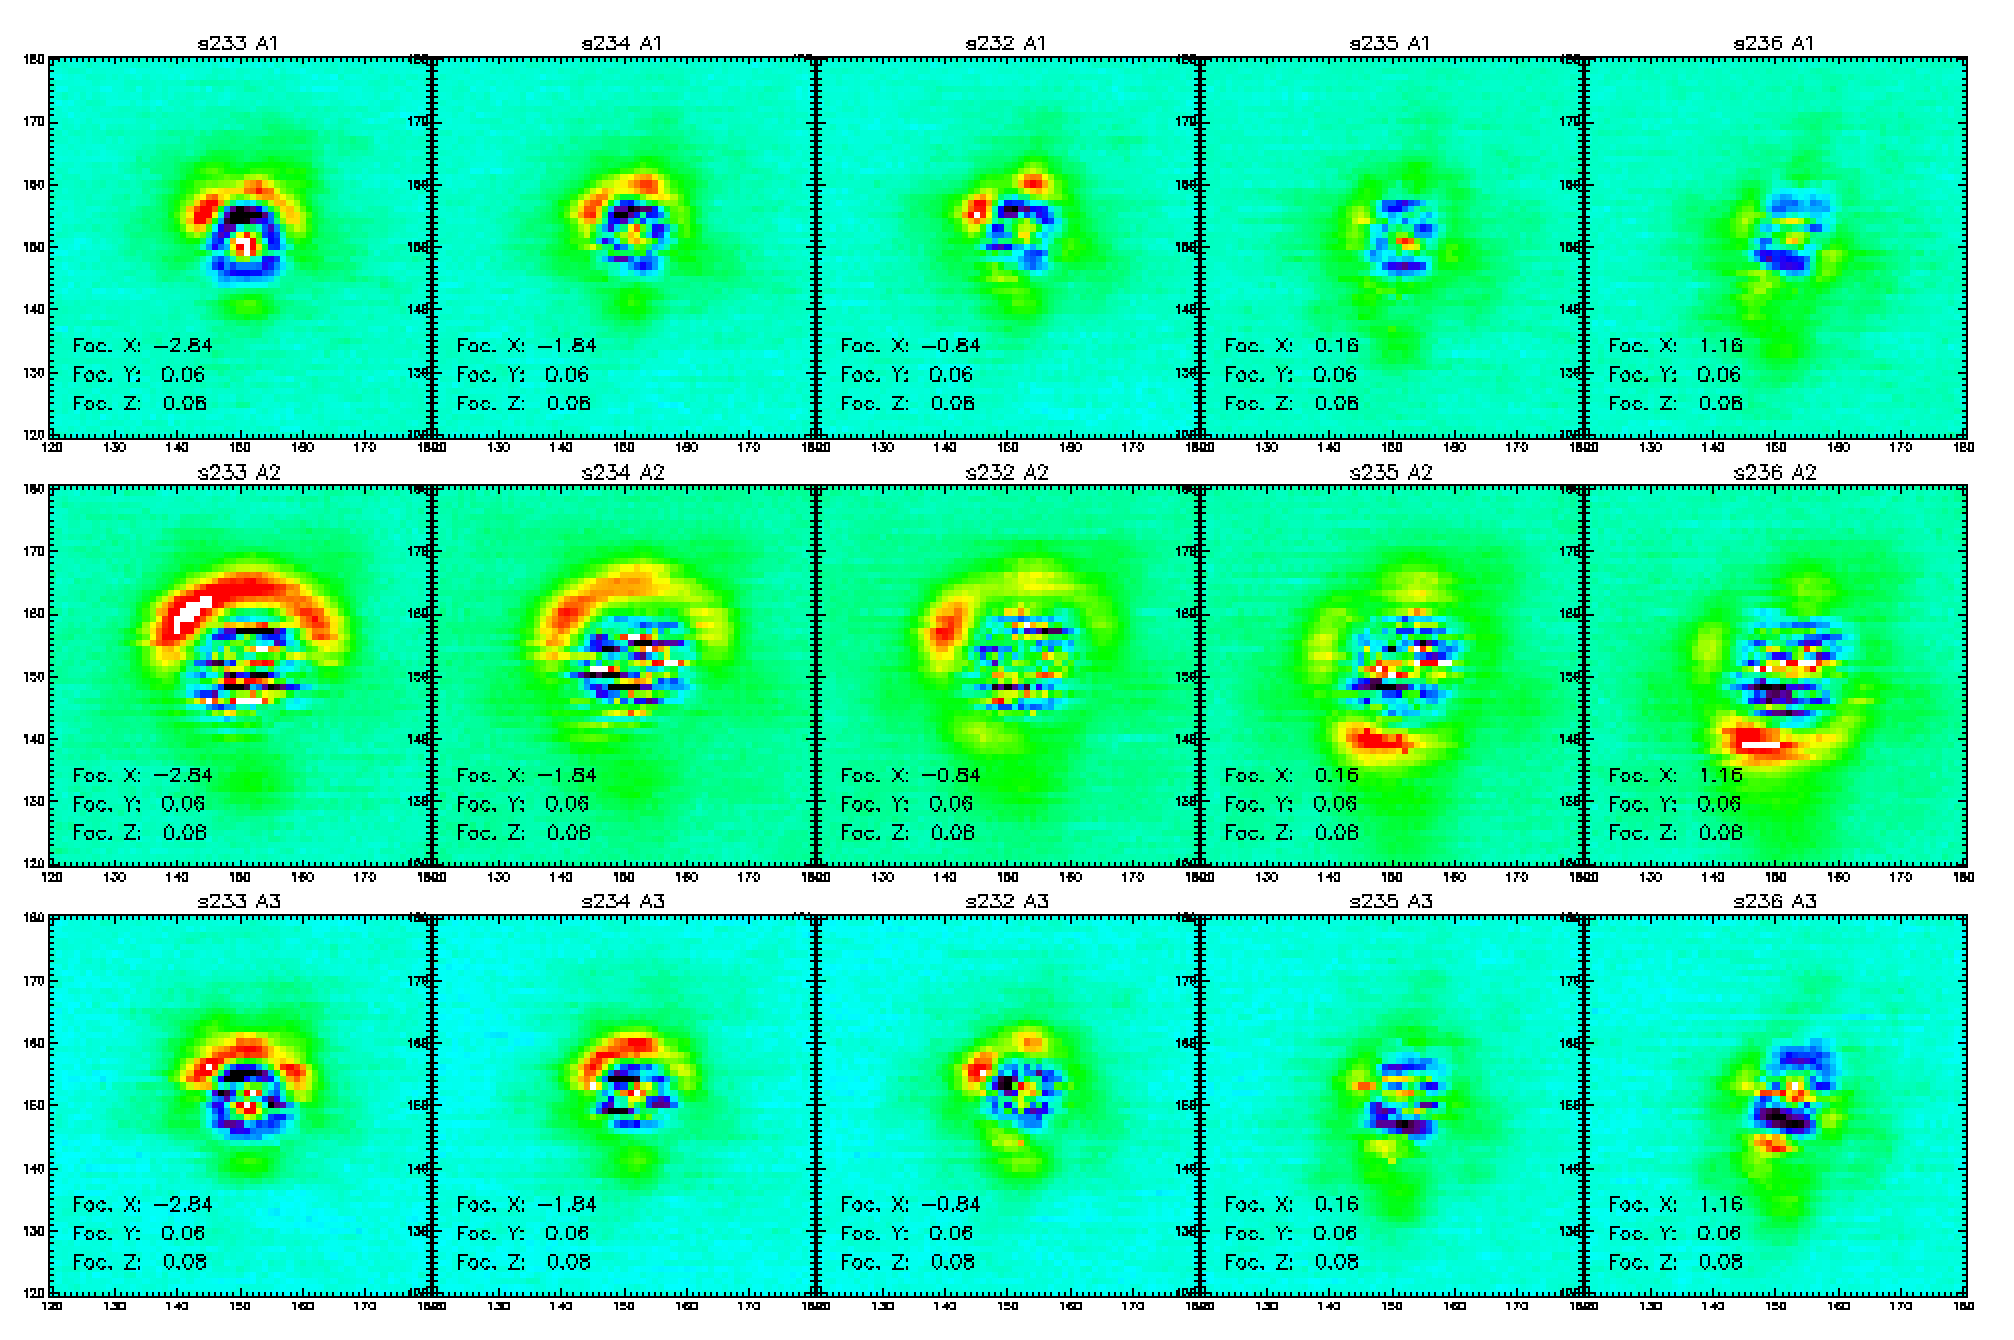
Defining the best focus corrections along the X and Y directions
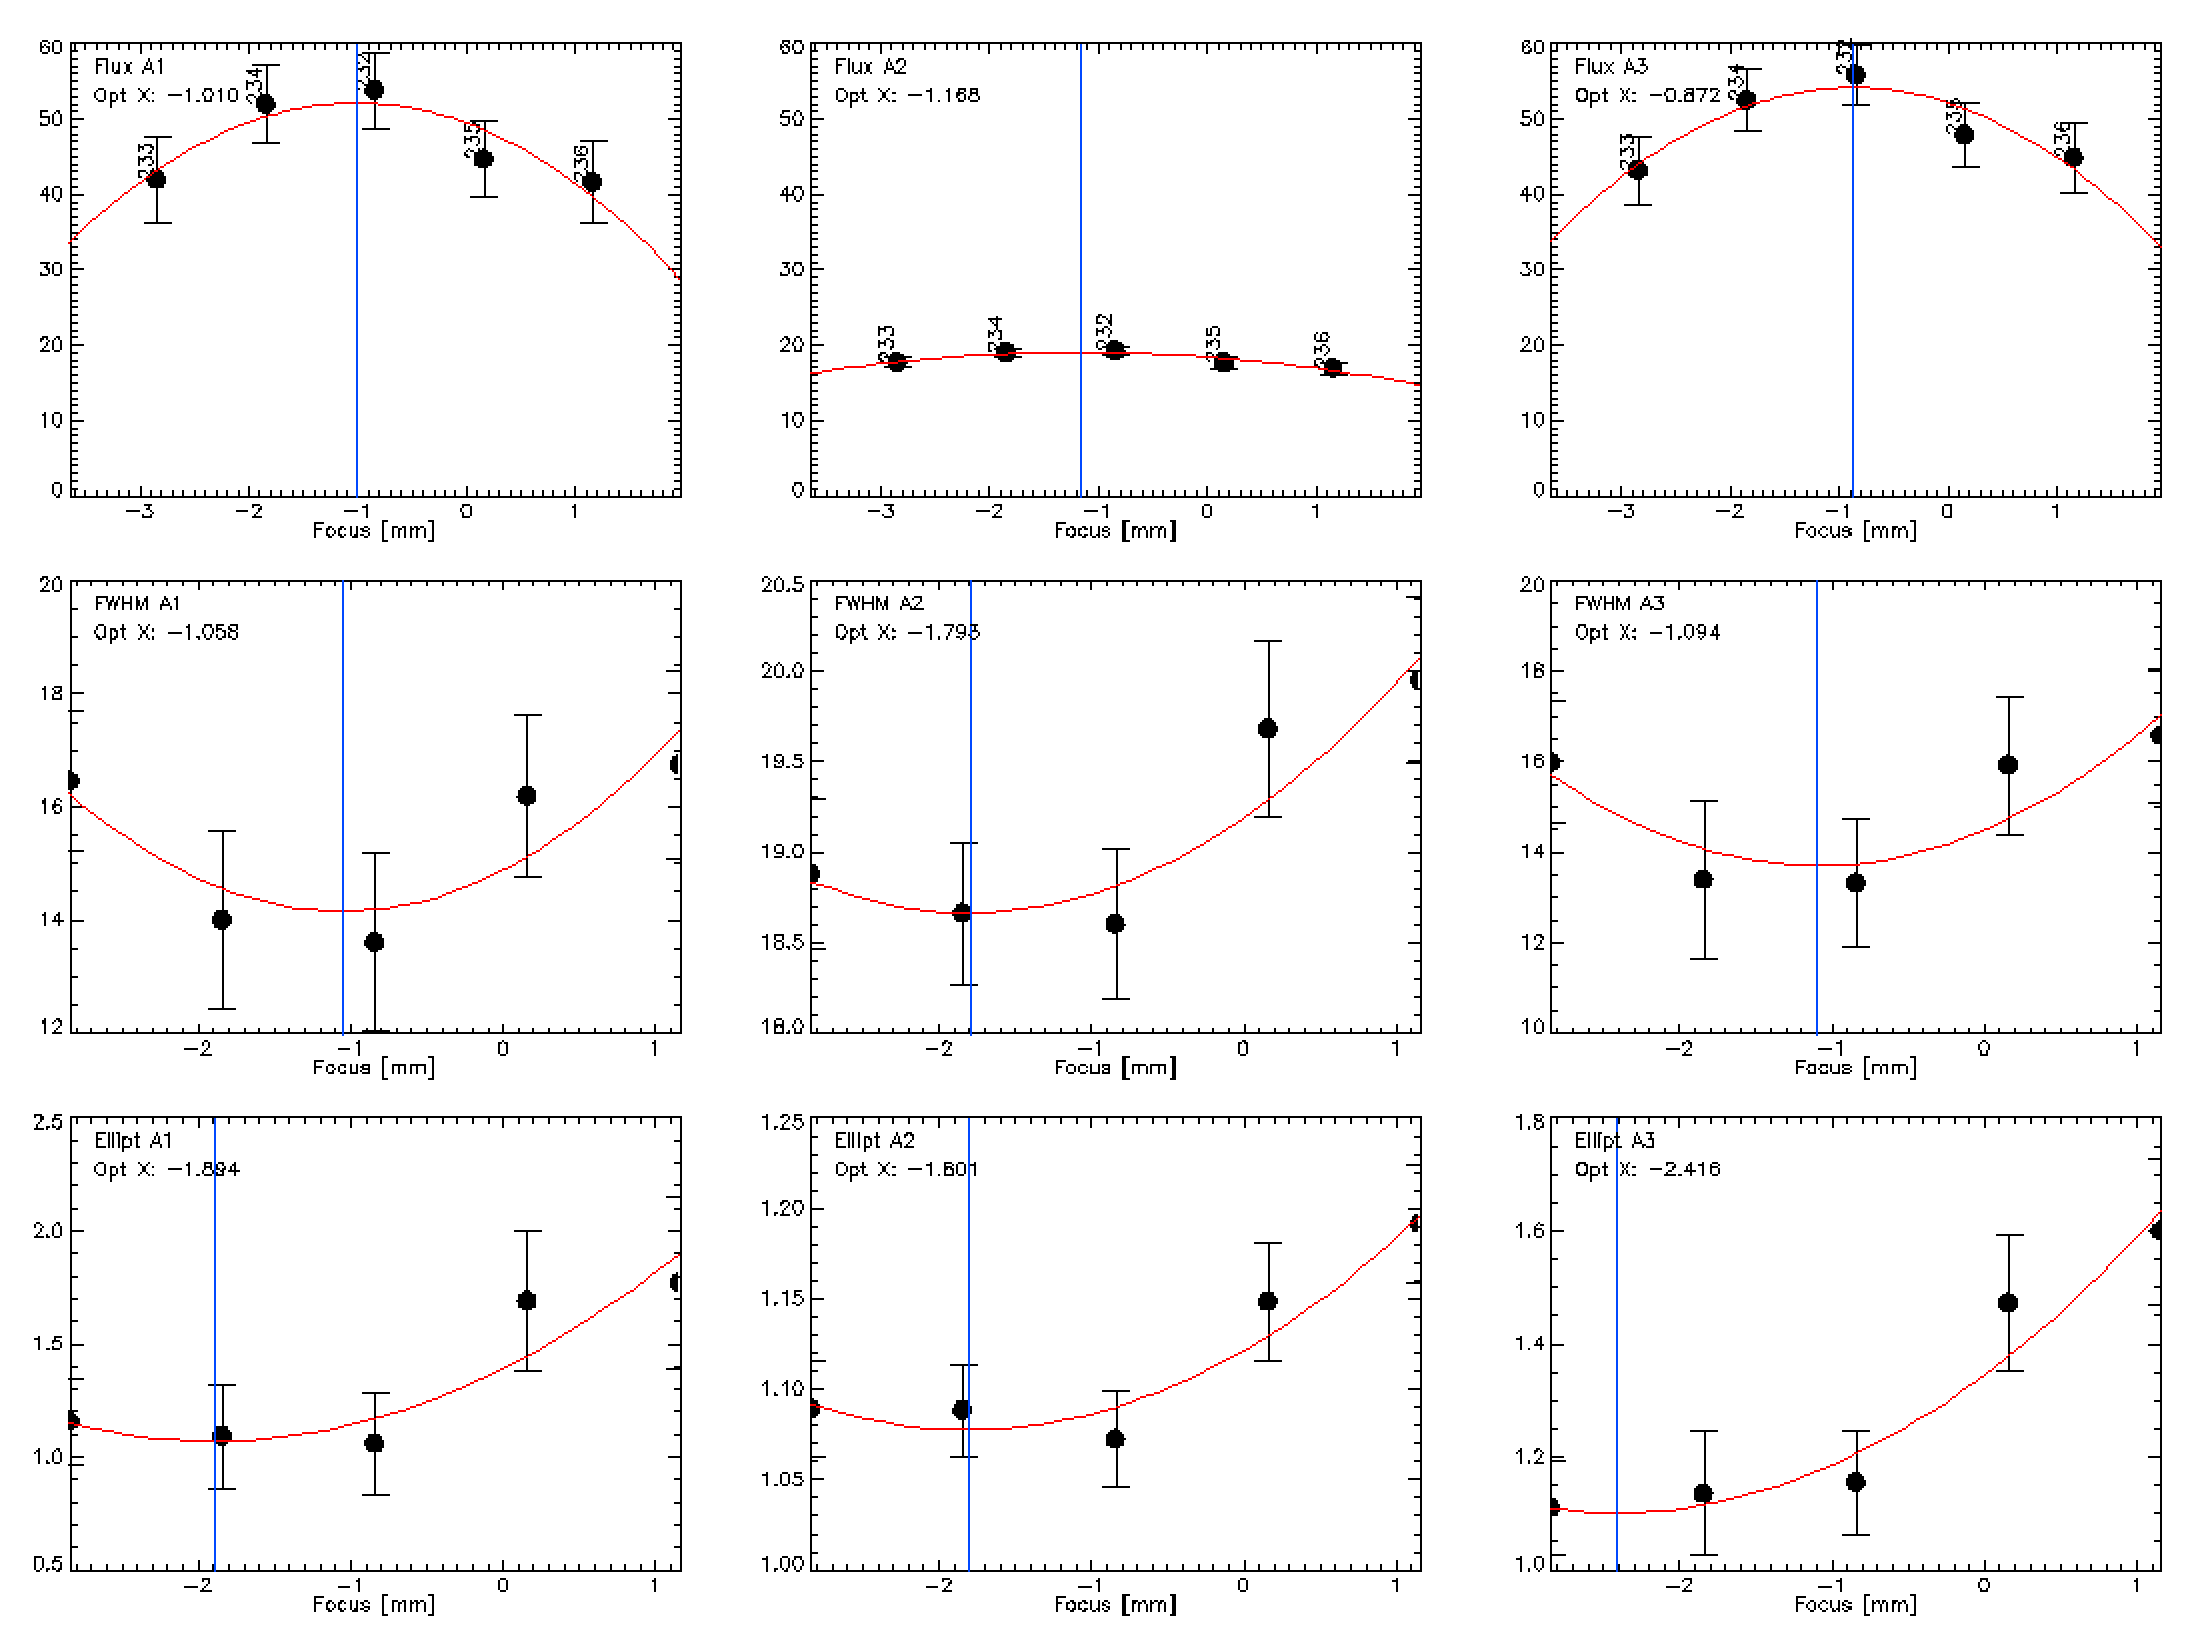
Reducing the data of the X and Y focus scans can lead to non trivial focus corrections due to the important error bars on the flux variation of the considered source. Most of the time, the variation of the flux is almost compatible with a flat curve (see figure below). Therefore, the maximum position of such curve is subject to large error bars which lead to non-optimal focus corrections along the X and Y directions. This is an important issue because the error beam shape depends to a large extend on the X and Y foci.
Robert Zylka suggested that we should instead use the maps of the error beam to minmize its deformation with respect to the focus variations. It is not a trivial thing to do because there is no figures such as the flux or the FWHM to optimize to get the focus correction and the error beam is not symetrical. Nevertheless, we can use the error beam shape information to reject focus corrections given by the standard analysis which lead to too deformed error beams at 1 and 2 mm.
We therefore added a module in the analysis code of focus scans in order to subtract the modeled main beam to the data and display the error beam maps as a function of the focus variation. The results we get for the focus scans 20161030s232-236 are presented below. Thus, we see that on this particular scan, the focus correction given by the standard analysis based on the maximization of the flux (~ -1 mm) is in strong disagreement with the one we could expect from the error beam shape. Indeed, with a -1 mm X-focus correction the error beam displays a strong asymetry with a "banana" shape next to the main beam. From these maps, we can instead expect a focus correction close to 0 which is still compatible with the standard analysis given the error bars (the computed fluxes for focus corrections of -1 mm and 0 mm are compatible).
This night (31/10/2016), we will therefore find the best X and Y focus corrections using this additional information and see if the beam shapes we get in the following beammmaps are improved.
Comment by CK: This is a very nice and useful work. In the example displayed below, the "error beam" or side lobe never completely disappears, but at least there is a x-focus where it is minimum. This may be due to a residual focus error in y. When the telescope is well focussed, I would hope that these side lobes disappear.
Florian Ruppin (31/10/2016)
