NIKA2 Run 6 Offline processing results
This private page is dedicated to results we get from a closer look to the raw data :
Calibrated Kidpar from the beammap 20161010s19 from the previous run
Using the beam map 20161010s19 (Uranus) from the the previous run (same configuration as the one we have now) we get the following KID positions after 2 iterations:
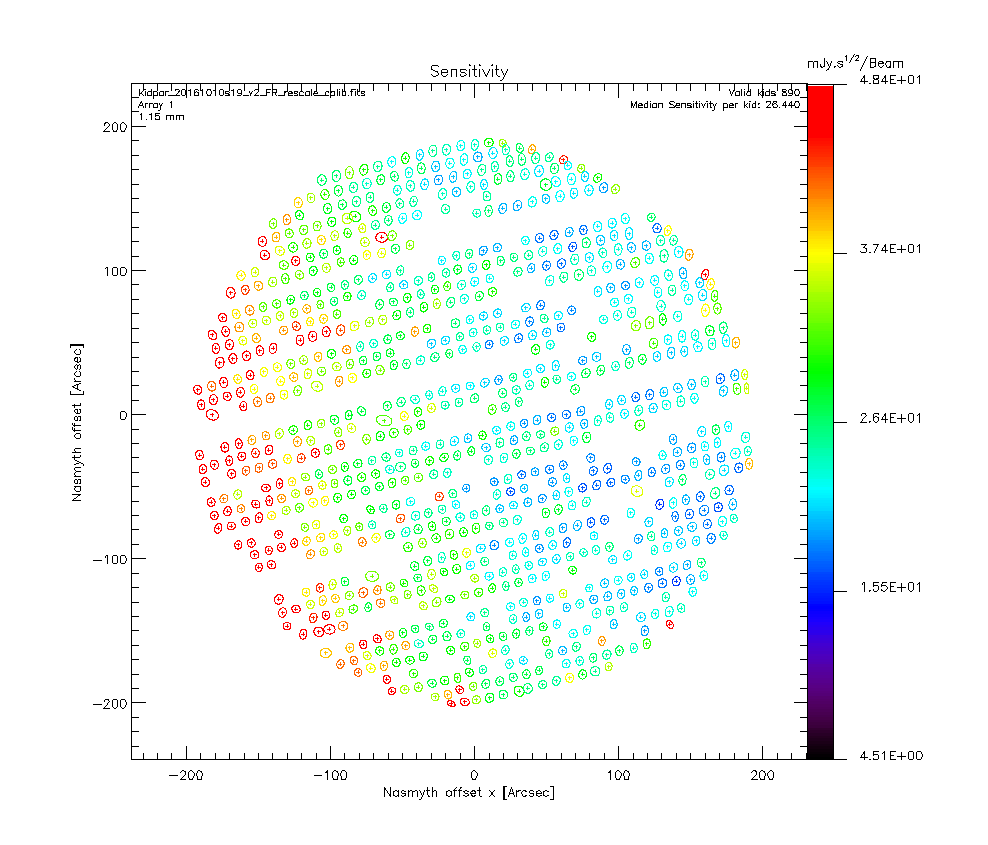
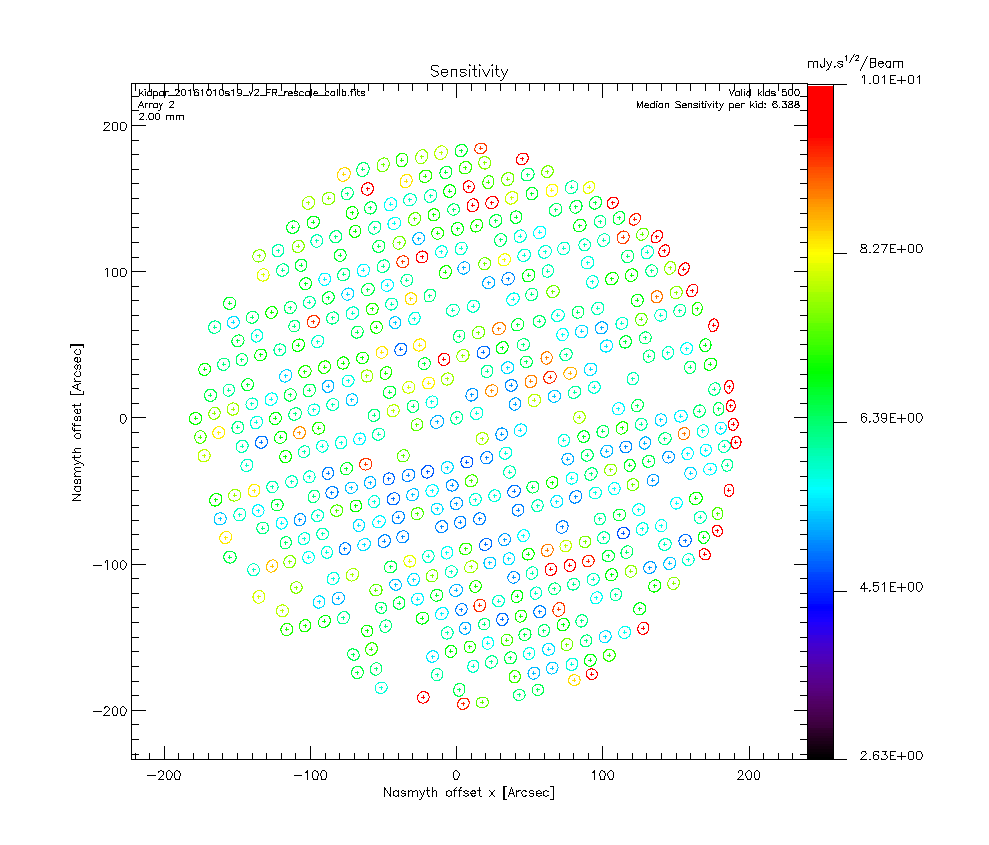
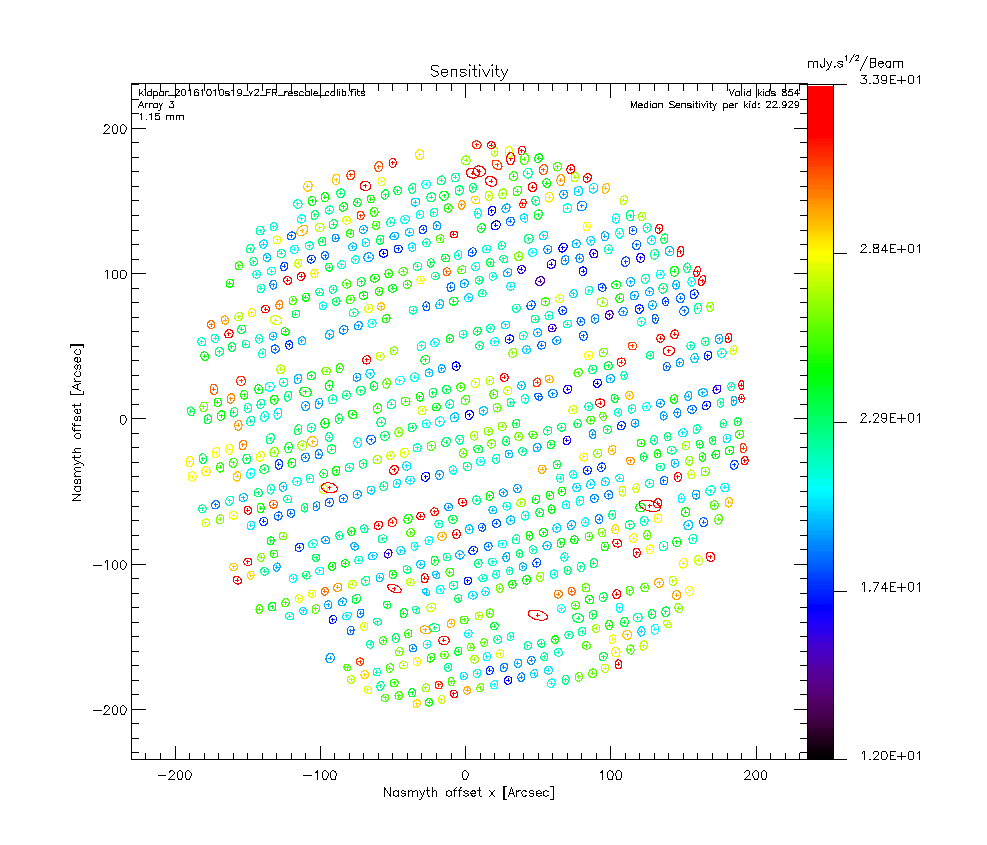
We use the skydip scan 20161026s115 of this run as it displays really good fits and the ratio tau_2mm/tau_1mm is around 0.65 as expected given the NIKA2 bandwidths. Therefore, the second iteration of the beammap processing takes into account opacity corrections which allows us to compute the KIDs calibration coefficients. The second step of the calibration coefficient computation consist in using the Kidpar and process several Uranus beammaps to get different measurements of its flux. We can then rescale the KID calibration coefficients so than the mean of the flux measurement distribution matches the expected Uranus fluxes at 1 and 2 mm. We use the beammaps 20161010s19, 20161010s37, 20161026s113, 20161026s114 as those are the only one we have on Uranus for this configuration. We get the following results:
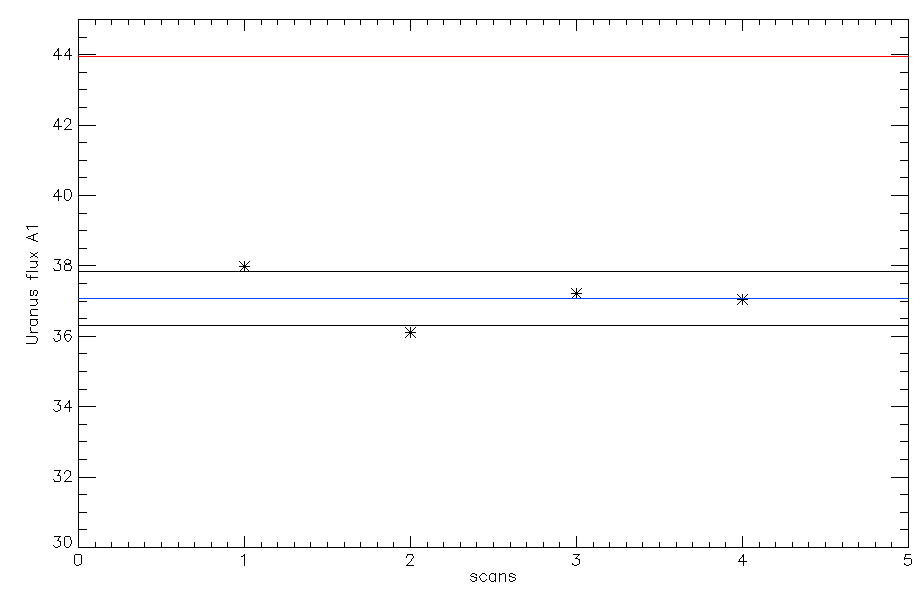
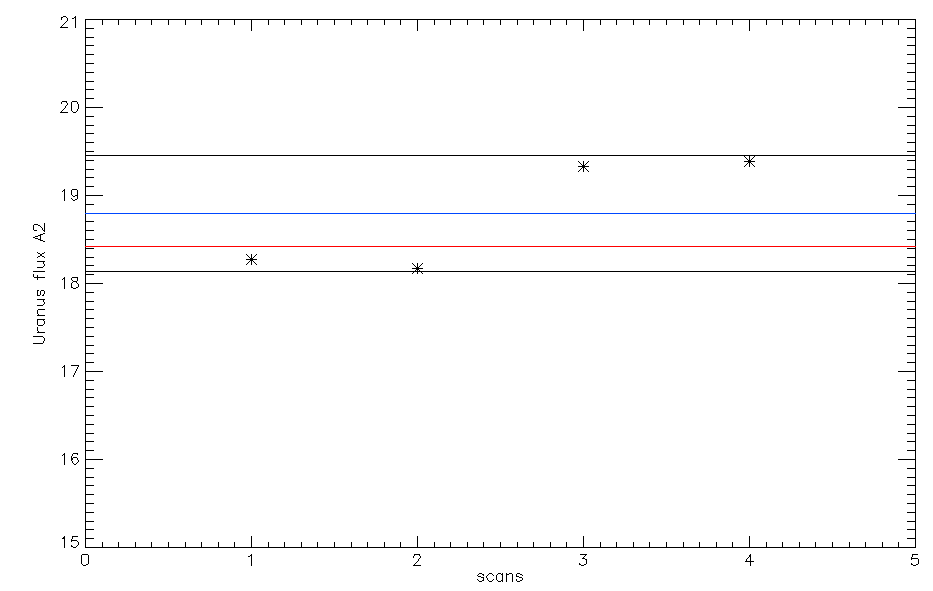
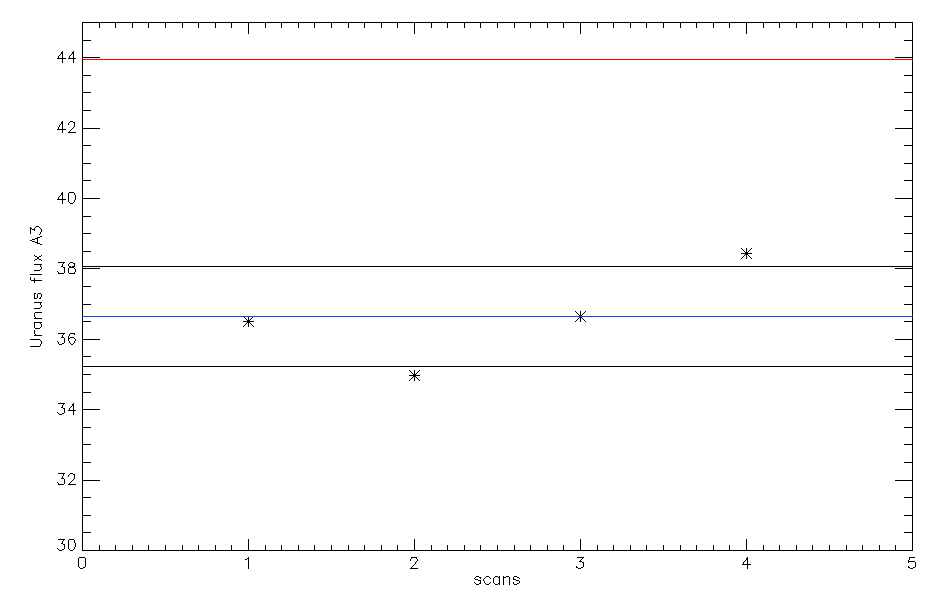
Ones the calibration coefficients are rescaled we can test this new Kidpar (kidpar_20161010s19_v2_FR_rescale_calib.fits) other sources to see if the measured fluxes matches the ones we expect. Using the beammaps we have on Neptune (20161026s80, 20161026s82) we get the following results:


We see that the measured fluxes (~17 Jy at 1 mm and ~7 Jy at 2 mm) are consistent with the expected fluxes of 16.54 and 6.93 Jy at 1 and 2 mm respectively. Therefore, the calibration coefficients seems correct to estimate the fluxes of the planets. We now test the calibration coefficients on a quasar. Using 2 beammaps on 3C84 (20161027s31, 20161027s32) and this new Kidpar, we get the following results:


The measured fluxes at 1 mm are consistent we the ones we expect (~ 10 Jy).
Eventually, we consider weaker sources to test the calibration. Flux measurements on CRL618 using the scans 20161028s54 and 20161028s55:

Flux measurements on Vesta using the scans 20161028s62 and 20161028s63:

FoV distortion from run5
Skydip analysis
Following the multi-scan analysis [http://www.iram.fr/wiki/nika2/index.php/April_12th,_2016,_FXD,_a_multi-scan_method_to_analyse_skydip_measurements], here are the figures for the 2 skydips of the 10th October 2016
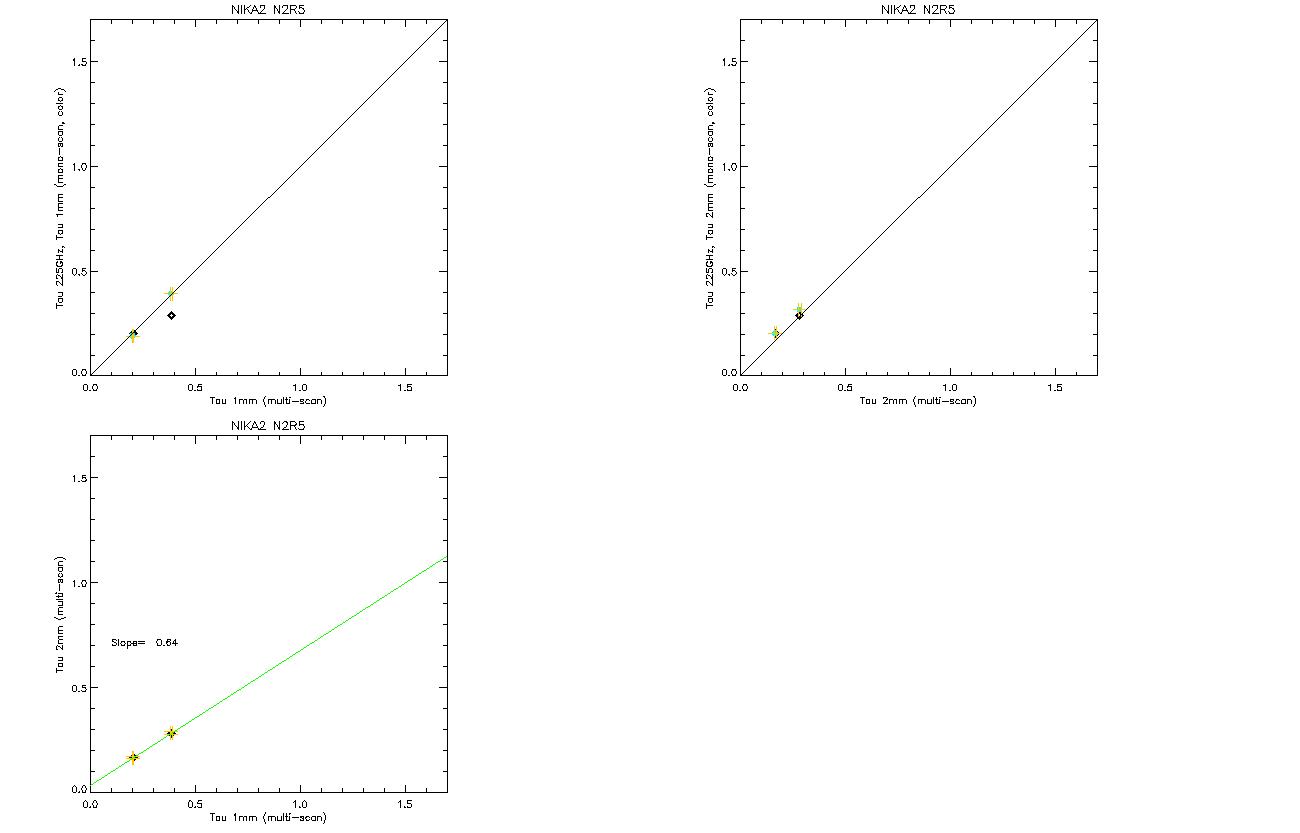
The plot shows that we recover the expected ratio of 0.65 between the opacity at 2mm and 1.2mm.
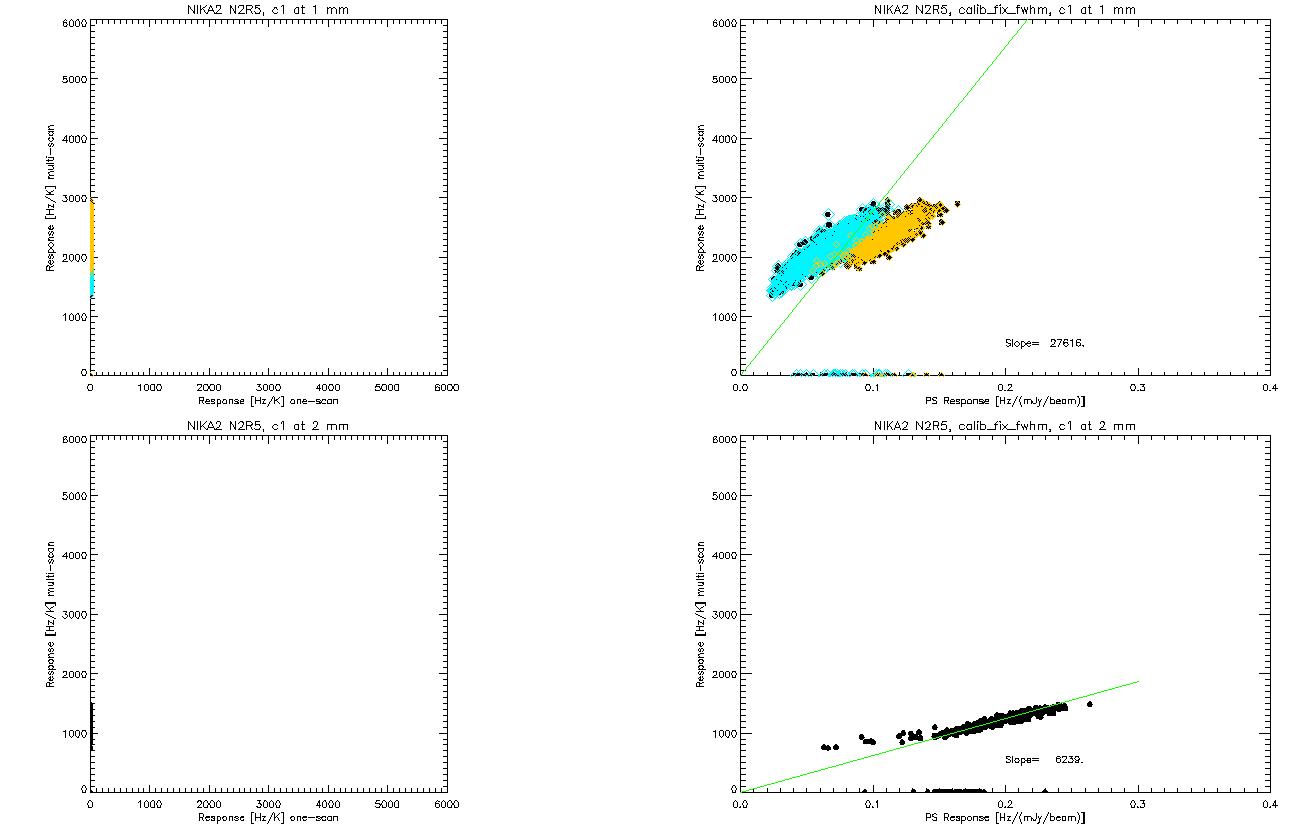
The other plot displays (on the right) the extended source sensitivity (established with the 2 skydips) vs. the PS sensitivity (established on Uranus). Note that the correlation is linear and goes through zero for the 2mm array whereas the 1mm arrays (blue and yellow) show a (too) wide range of PS sensitivities. This issue has been raised several times now.
