|
Size: 2009
Comment:
|
Size: 1940
Comment:
|
| Deletions are marked like this. | Additions are marked like this. |
| Line 16: | Line 16: |
| NIKA2 maps of NGC891 at 1mm (Upper) and at 2mm (Lower), after correction for the position angle of 22.5deg. The maps cover 12'x2' and show half-power beamwidths of 12" and 18". Contours show 10% (dashed), and 20% to 80% in steps of 20% (drawn) of the peak flux densities (82mJy/beam at 1mm and 18mJy/beam at 2mm). Peak 1.3mm flux density of Guelin et al. (1996) is 62mJy/beam. The 1mm map of Guelin et al. shows much more detailed structure than the NIKA2 1mm map though the resolutions should be very similar. The surroundings of the galaxy still show somewhat negative flux densities, as a histogram of all flux densities would show more clearly. One of the next steps is to construct averages along the major axes, also to compare with Figure 2 in Hughes et al.. The vertical profile in Figure 2 of Guelin et al. looks very strange in comparison with the profiles from PACS and SPIRE maps. (CK 17-Jan-2016) | NIKA2 maps of NGC891 at 1mm (Upper) and at 2mm (Lower), after correction for the position angle of 22.5deg. The maps cover 12'x2' and show half-power beamwidths of 12" and 18". Contours show 10% (dashed), and 20% to 80% in steps of 20% (drawn) of the peak flux densities (82mJy/beam at 1mm and 18mJy/beam at 2mm). Peak 1.3mm flux density of Guelin et al. (1996) is 62mJy/beam. The surroundings of the galaxy still show somewhat negative flux densities, as a histogram of all flux densities would show more clearly. The vertical structure seen in the NIKA2 maps looks very smooth, qualitatively similar to the Herschel maps shown in Hughes et al.. One of the next steps is to construct averages along the major axes, also to compare with the vertical profiles constructed from PACS and SPIRE maps (Fig. 2 in Hughes et al.). (CK 17-Jan-2016) |
Back to NIKA2 Run1 Offline processing page
Extended sources
Page last updated, FXD 15-Jan-2016; CK 7-Jan-2016; FXD 6-Jan-2016
NGC891
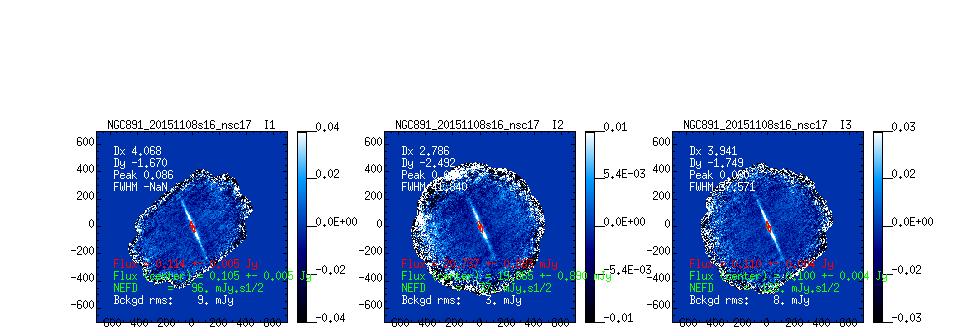
An offline data reduction was made using the 16 scans performed during good weather. The nk pipeline Rev 9881 was used with a single point source as a mask and a single common mode removal. Both 1mm arrays are used and coadded in a single map. Here are the data : say V1
The data will soon be reprocessed by masking the whole edge-on galaxy. Here they are : say V2

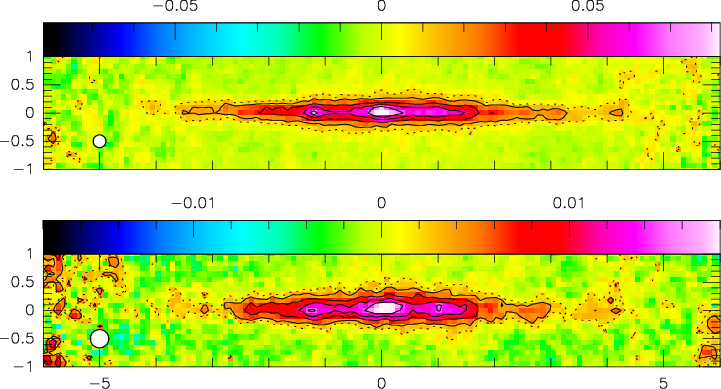
 NIKA2 maps of NGC891 at 1mm (Upper) and at 2mm (Lower), after correction for the position angle of 22.5deg. The maps cover 12'x2' and show half-power beamwidths of 12" and 18". Contours show 10% (dashed), and 20% to 80% in steps of 20% (drawn) of the peak flux densities (82mJy/beam at 1mm and 18mJy/beam at 2mm). Peak 1.3mm flux density of Guelin et al. (1996) is 62mJy/beam. The surroundings of the galaxy still show somewhat negative flux densities, as a histogram of all flux densities would show more clearly. The vertical structure seen in the NIKA2 maps looks very smooth, qualitatively similar to the Herschel maps shown in Hughes et al.. One of the next steps is to construct averages along the major axes, also to compare with the vertical profiles constructed from PACS and SPIRE maps (Fig. 2 in Hughes et al.). (CK 17-Jan-2016)
References
Guelin et al. 1996: 7-channel/30m 1.3mm observations
Hughes et al. 2014: Herschel observations
