|
Size: 649
Comment:
|
← Revision 7 as of 2013-06-18 02:34:16 ⇥
Size: 987
Comment:
|
| Deletions are marked like this. | Additions are marked like this. |
| Line 11: | Line 11: |
== Possible interpretation == .The slopes of 0.6 and 1.25 correspond respectively to spectral index of +1 and -0.4. We might understand it if we consider that the contribution of the emission of M82 is due to dust and free-free. The center of M82 is therefore dominated by free-free emission and the outskirt is dominated by dust. |
M82 spectrum
Results
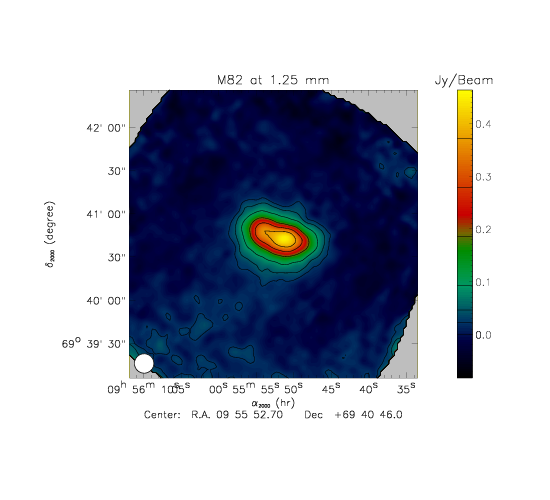
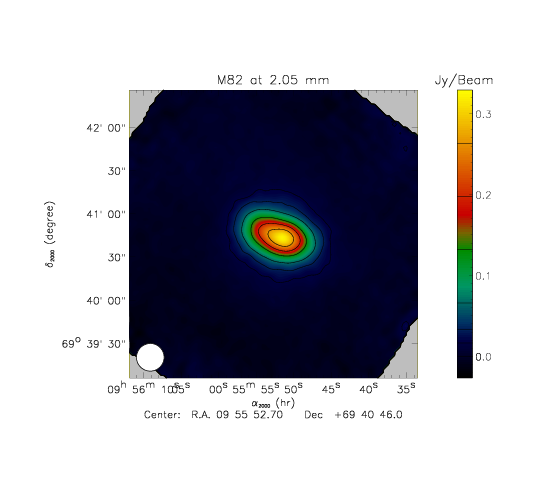
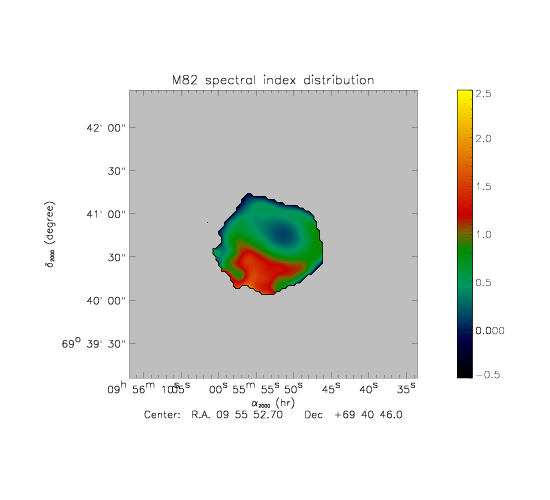
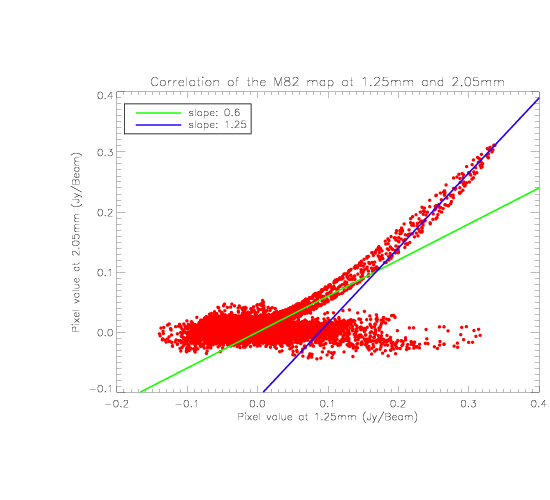
- The spectrum map is defined by index = log(Map_140/Map_240)/alog(140.0/240.0). We can clearly see a change in the spectral index in the source. This is confirmed by the correlation plot which shows the values in the pixel of the 240 GHz map as a function of the value of the corresponding 140GHz map.
Possible interpretation
- The slopes of 0.6 and 1.25 correspond respectively to spectral index of +1 and -0.4. We might understand it if we consider that the contribution of the emission of M82 is due to dust and free-free. The center of M82 is therefore dominated by free-free emission and the outskirt is dominated by dust.


