|
Size: 502
Comment:
|
Size: 991
Comment:
|
| Deletions are marked like this. | Additions are marked like this. |
| Line 3: | Line 3: |
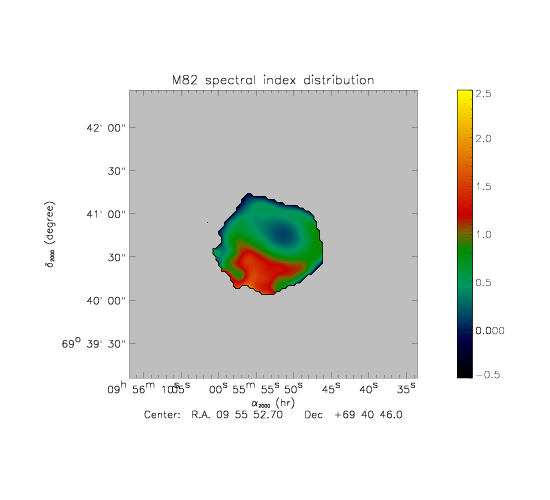
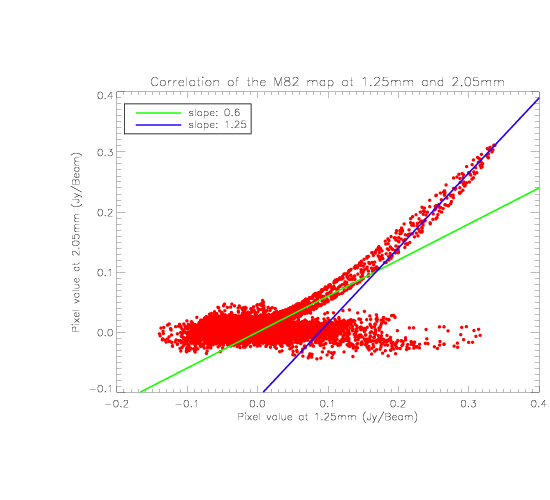
| .Warning: the data are apparently not well calibrated yet, so the plots shown below might not be correct for now. | == Results == .The spectrum map is defined by index = log(Map_140/Map_240)/alog(140.0/240.0). We can clearly see a change in the spectral index in the source. This is confirmed by the correlation plot which shows the values in the pixel of the 240 GHz map as a function of the value of the corresponding 140GHz map. |
| Line 5: | Line 6: |
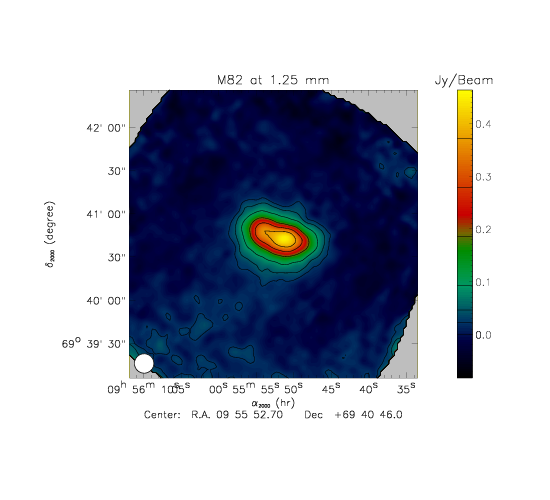
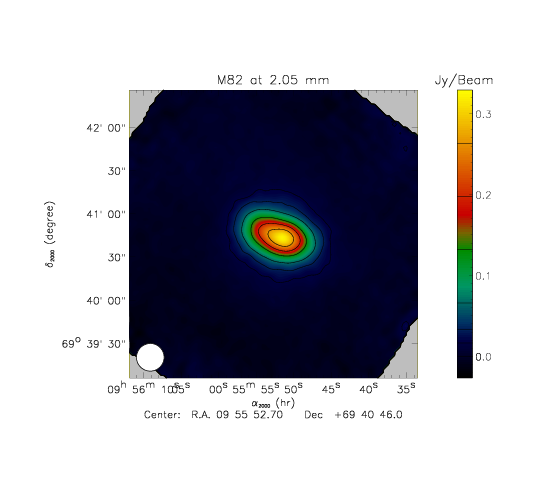
| || {{attachment:1mm_map_m82.png}} || {{attachment:2mm_map_m82.png||width=550,height=400}} || || [[attachment:1mm_map_m82.pdf]] || [[attachment:2mm_map_m82.pdf]] || |
|| {{attachment:1mm_map_m82.png}} || {{attachment:2mm_map_m82.png}} || {{attachment:spectre.png}} || || [[attachment:1mm_map_m82.pdf]] || [[attachment:2mm_map_m82.pdf]] || [[attachment:spectre.pdf]] || |
| Line 8: | Line 9: |
| || {{attachment:correlation.png||width=550,height=400}} || | || {{attachment:correlation.png||width=850,height=700}} || |
| Line 11: | Line 12: |
| || {{attachment:spectre.png||width=550,height=400}} || || [[attachment:spectre.pdf]] || |
== Possible interpretation == .The slopes of 0.6 and 1.25 correspond respectively to spectral index of +1 and -0.4. We might understand it if we consider that the contribution of the emission of M82 is due to dust and synchrotron. The center of M82 is therefore dominated by synchrotron emission and the outskirt is dominated by dust. |
M82 spectrum
Results
- The spectrum map is defined by index = log(Map_140/Map_240)/alog(140.0/240.0). We can clearly see a change in the spectral index in the source. This is confirmed by the correlation plot which shows the values in the pixel of the 240 GHz map as a function of the value of the corresponding 140GHz map.
Possible interpretation
- The slopes of 0.6 and 1.25 correspond respectively to spectral index of +1 and -0.4. We might understand it if we consider that the contribution of the emission of M82 is due to dust and synchrotron. The center of M82 is therefore dominated by synchrotron emission and the outskirt is dominated by dust.


