=== How To create the Pointing Plot ===
Download the Python Script
First off all you need the up-to-date version of the python script "plPoiFoc.py" that creates the plot. This can be downloaded here:
http://bazaar.launchpad.net/~ascurion/+junk/plPoiFoc/files
If you want you can contribute to the code via launchpad or send me changes you made so that I can include them. Any suggestions and improvements are welcome.
== Get the Pointing results from Projects ==
Enter the Tapas webpage: https://mrt-lx3.iram.es/tapas/ . You'll have to log in with staff permissions to see the information of all projects. Please ask the computer group or me for the login details in case you don't know.
After logging in, go to the search form and enter the time range you want to display the pointing results for:
Now you'll obtain a somewhat confusing list of scans and projects that have been observed during that time:

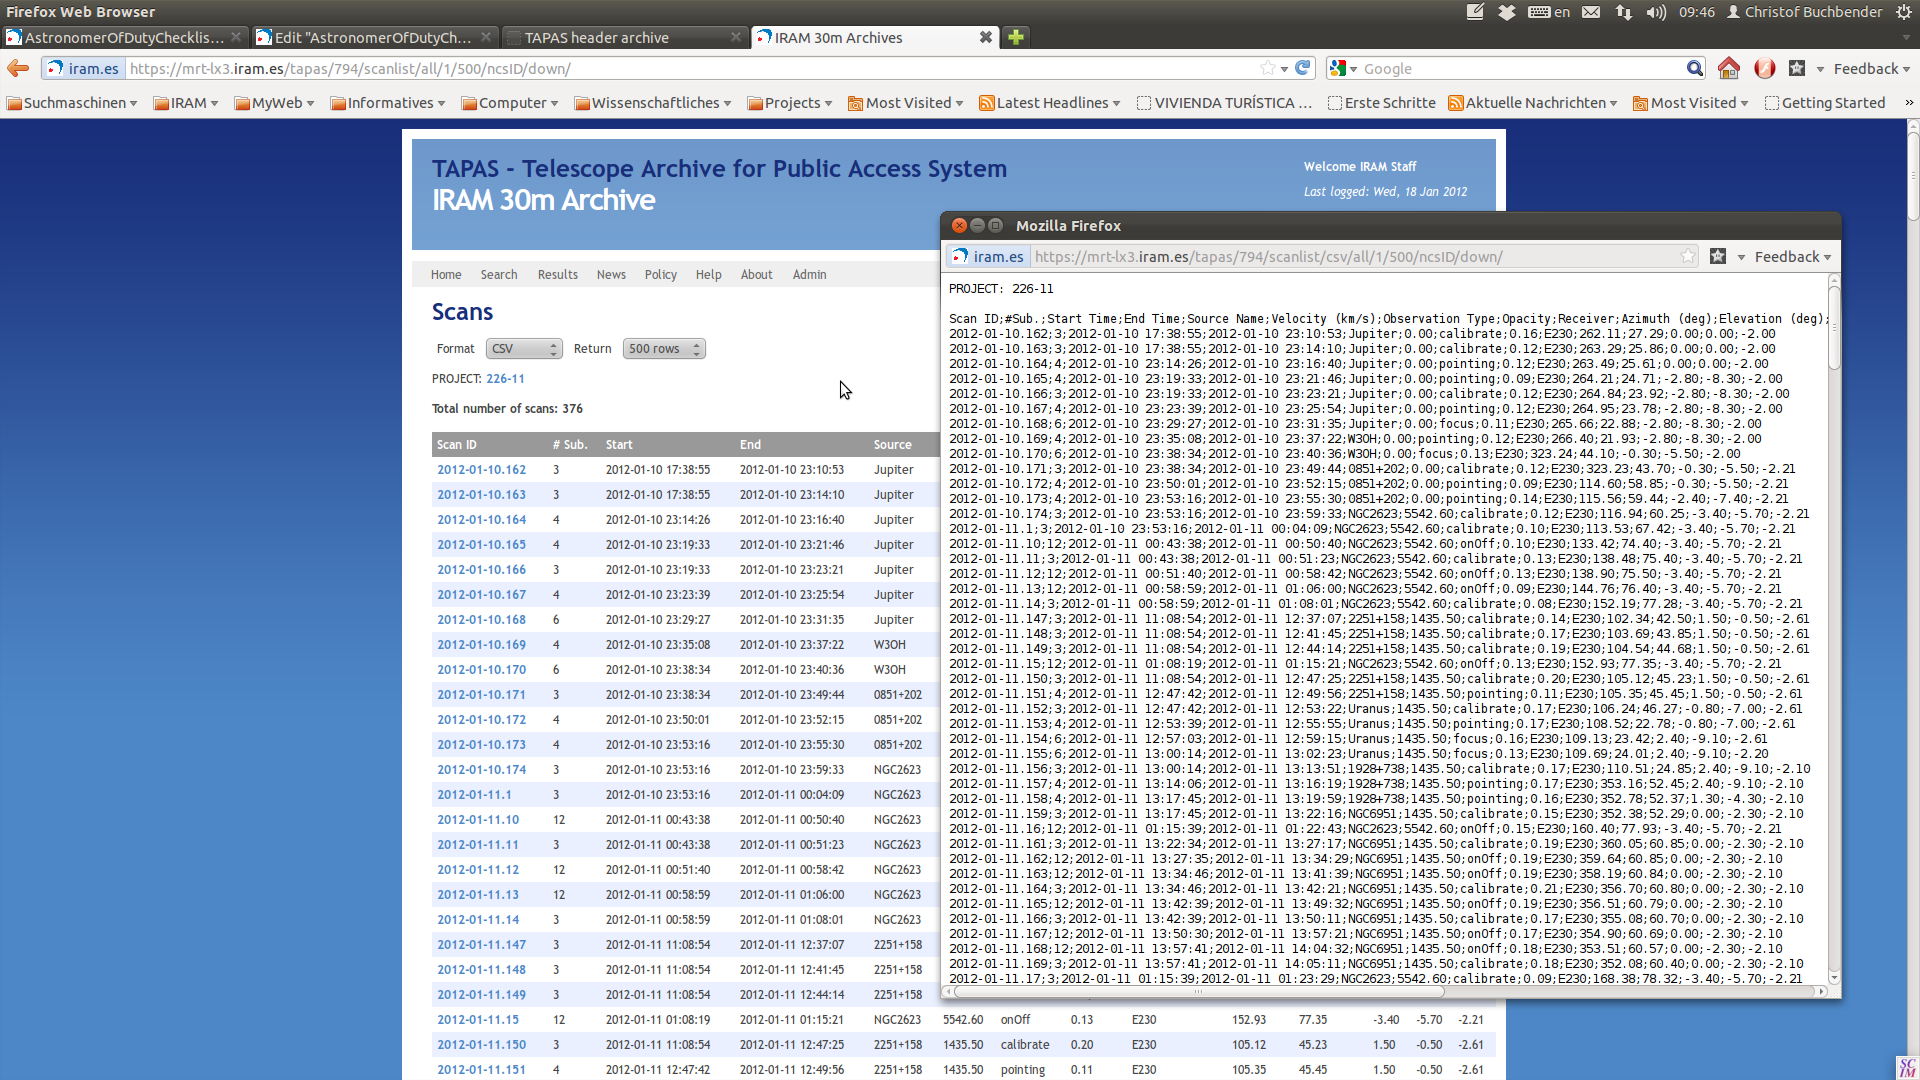
To get the pointing results and the data format the program reads you have to select one project like shown in the previous image (Project 266-11). Clicking on a project name leads you to this page:
Where you have to selcet the link '#All Scans' like indicated in the image. Now you'll get a list of all scans made in this project.
Note, that thus the scans may excced the time range you have selected at the beginning. Long projects like the flux-monitoring easily cover months, if not years.
On the top of the page you can adjust the number of scans shown by changing the number of Rows. This number should be always larger than the number of total scans to get all the scans. Then to get the information in the format the pyhton script accepts you have to change "Format" to CSV. This results in a pop up that is also displayed in the previous image.
== Creating the input File for the Python Script ==
The information in the format displayed in the pop up is what the python script expects. To get the script to work you'll need to create a text file that is called exactly:
pointFocus.txt
Into this text file you just need to copy the output displayed in the pop-up created by TAPAS. Important is that you don't copy the first three lines, i.e. the line staring with "Project" the empty line and the one starting with "Scan".
It is also important that there are no empty lines in pointFocus.txt!
== Creating the Plot==
To create the plot, once you have the text file ready. You have to have plPotFoc.py and pointFocus.txt in the same directory and execute in the terminal:
python plPotFoc.py
This will print out the mean pointing and focus corrections on the screen. And create the pointing plot named: plPoiFoc.eps.
== Plotting more than one project==
To plot more than one project you just have to add the content of the CSV pop-up of the projects to pointFocus.txt, every time without the first three lines and letting no line empty:
