|
Size: 3021
Comment:
|
Size: 6699
Comment:
|
| Deletions are marked like this. | Additions are marked like this. |
| Line 1: | Line 1: |
| = How-To create the Pointing Plot = | = How To create the Pointing Plot = <<TableOfContents(5)>> == Example Plot == {{attachment:plPoiFoc.png|width=70%}} == NEW SQL powered version of the script == The pointFoc.py script now accses the Tapas database directly via a MySQL search. Now all used pointing corrections between two dates, for one project, or one project between two dates can be display with one command. Please refer to the Usage instructions below. On '''mrt-lx3''' the script is available systemwide for all users via: {{{ > pointFoc.py }}} For help see {{{ > pointFoc.py -h }}} If you want to use the script on other machines, please download the up-to-date version as instructed below. Using the script on your machine the command is: {{{ > python pointFoc.py }}} You have to have: matplotlib, numpy, MySQLdb and getpass installed on your machine. '''Important''' Since the script accesses Tapas directly it is secured with a password, which is the same as for the iramstaff account of the Tapas database. == Usage Instructions == This script creates a plot of the 30m pointing and focus used for observations for: a) all scans between two dates<<BR>> b) one specific project<<BR>> c) one specific project between two dates.<<BR>> Input variables are:<<BR>> -s, --start : reads in Start Date<<BR>> -e, --end : reads in End Date<<BR>> -p, --project : reads in Project Name<<BR>> -o, --output : reads file name to save the Plot<<BR>> -f, --Format : sets the graphic format (eps, png, pdf)<<BR>> -h, --help : print this help<<BR>> The format for dates need to be 'Year-Month-Day', e.g. '2012-01-06'<<BR>> optionally a time can be also given by 'Year-Month-Day Hour:Minute:Second',<<BR>> e.g. '2012-01-06 21:56:45'; with a space in between the Date and the Time.<<BR>> Projects names are the 30m names, e.g. '105-09' or 'monitoring' etc..<<BR>> For a) give only start and end dates<<BR>> for b) only Project Name<<BR>> for c) all three parameters.<<BR>> '''Defaults:'''<<BR>> A plot of all pointings and focus values of the <<BR>> last week is the Default if nothing is specified.<<BR>> The default output file is 'plPoiFoc.eps' in eps format. <<BR>> Via -o and -f name and format can be changed respectively. <<BR>> Possible formats are png, eps, pdf, jpg. <<BR>> '''Usage Examples:''' <<BR>> (on mrt-lx3 skip python before the script name)<<BR>> Case a): {{{ > python pointFoc.py -s '2012-01-06' -e '2012-01-16' }}} Case b): {{{ > python pointFoc.py -p '145-11' }}} Case c) {{{ > python pointFoc.py -s '2012-01-06' -e '2012-01-16' -p '145-11' }}} Change plot name/path and format:<<BR>> {{{ > python pointFoc.py -p '145-11' -o 'newName.png' -f 'png' }}} |
| Line 6: | Line 103: |
| First off all you need the up-to-date version of the python script "plPoiFoc.py" that creates the plot. | First off all you need the up-to-date version of the python script "pointFoc.py" that creates the plot. |
| Line 15: | Line 112: |
| == Get the Pointing results from Projects == | == In case of Problems == If you get error messages and/or fail to create the plot, please check if you have the latest code. If so you may contanct me (CB, buchbend AT iram.es). = OLD Instructions = Script Revisions 4 and earlier on launchpad. == Get the Pointing results from Projects == |
| Line 19: | Line 126: |
| Please ask the computer group or me for the login details in case you don't know. After logging in go to the search form and enter the time range you want |
Please ask the computer group or me (CB) for the login details in case you don't know. After logging in, go to the search form and enter the time range you want |
| Line 25: | Line 132: |
| Now you'll obtain a somewhat confusing list of scans and projects that have been observed during that time: To get the pointing results and the data format the program reads you have to select one project like shown in the previous image (Project 266-11). Clicking on a project name leads you to this page: Where you have to selcet the link '#All Scans' like indicated in the image. Now you'll get a list of all scans made in this project. Note, that thus the scans may excced the time range you have selected at the beginning. Long projects like the flux-monitoring easily cover months, if not years. On the top of the page you can adjust the number of scans shown by changing the number of Rows. This number should be always larger than the number of total scans to get all the scans. Then to get the information in the format the pyhton script accepts you have to change "Format" to CSV. This results in a pop up that is also displayed in the previous image. == Creating the input File for the Python Script == The information in the format displayed in the pop up is what the python script expects. |
{{attachment:searchForm2.png||width=70%}} Now you'll obtain a somewhat confusing list of scans and projects that have been observed during that time: {{attachment:selectProject2.png||width=70%}} To get the pointing results and the data format the program reads you have to select one project like shown in the previous image (Project 266-11). Clicking on a project name leads you to this page: {{attachment:scan2.png||width=70%}} Here you have to select the link '#All Scans' like indicated in the previous image. Now you'll get a list of all scans made in this project: {{attachment:List2.png||width=70%}} Note, that the scans may exceed the time range you have selected at the beginning, since this page displays all scans of a project. Long projects like the flux-monitoring easily cover months. On the top of the page you can adjust the number of scans shown by changing the number of Rows. This number should always be larger than the number of total scans to assure that all scans are displayed. Finally, to get the information in the format the python script accepts you have to change "Format" to CSV. This results in the pop-up that is also displayed in the previous image. == Creating the input File for the Python Script == The information and format displayed in the CSV pop-up is what the python script expects. |
| Line 48: | Line 189: |
| Into this text file you just need to copy the output displayed in the pop-up created by TAPAS. Important is that you '''don't''' copy the first three lines, i.e. the line staring with "Project" the empty line and the one starting with "Scan". It is also important that there are no empty lines in pointFocus.txt! == Creating the Plot== To create the plot, once you have the text file ready. You have to have '''plPotFoc.py''' and '''pointFocus.txt''' in the same directory and execute in the terminal: ''' python plPotFoc.py ''' This will print out the mean pointing and focus corrections on the screen. And create the pointing plot named: '''plPoiFoc.eps'''. == Plotting more than one project== To plot more than one project you just have to add the content of the CSV pop-up of the projects to '''pointFocus.txt''', every time without the first three lines and letting no line empty: |
Please then copy the output displayed in the pop-up created by TAPAS into this text file. == Creating the Plot == '''Important''' for the script to work is that the PC that you are using has numpy and matplotlib, two python packages, installed. At the moment, without gra-lx4 available, only '''gra-lx18''', my machine, has the right preferences, as far as I know. '''Update by AS:''' Now the script can also be used on the '''mrt-aod''' and '''mrt-lx3''' computers. To create the plot, once you have the text file ready, you have thus to log into gra-lx18 and having '''pointFoc.py''' and '''pointFocus.txt''' in the same directory you need to execute in a terminal: ''' python pointFoc.py ''' This will print out the mean pointing and focus corrections on the screen and create the pointing plot named: '''plPoiFoc.eps''' in the same folder. == Plotting more than one project == To plot more than one project you just have to add the content of the CSV pop-up of the all projects to the same '''pointFocus.txt'''. Just append the new scans to the bottom of the already existing text file. The script orders the scans in time on its own. Don't worry about empty lines or lines that have not the right format since they are filtered out by the script. |
How To create the Pointing Plot
Contents
Example Plot
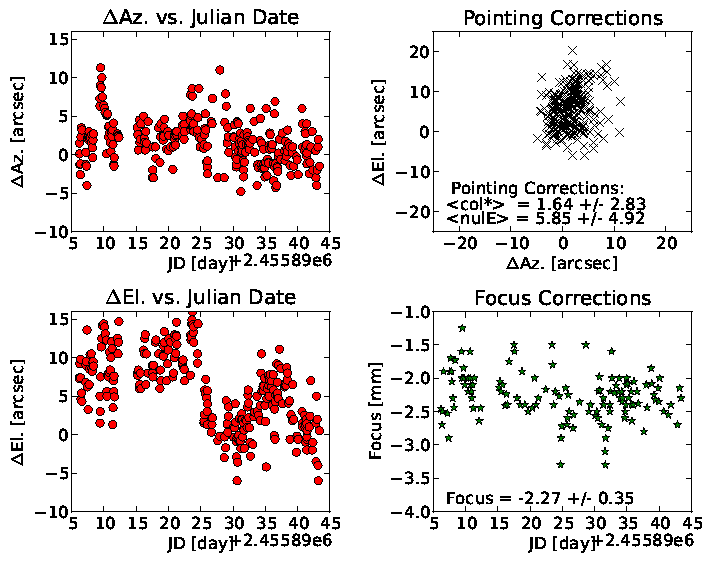
NEW SQL powered version of the script
The pointFoc.py script now accses the Tapas database directly via a MySQL search. Now all used pointing corrections between two dates, for one project, or one project between two dates can be display with one command. Please refer to the Usage instructions below.
On mrt-lx3 the script is available systemwide for all users via:
> pointFoc.py
For help see
> pointFoc.py -h
If you want to use the script on other machines, please download the up-to-date version as instructed below. Using the script on your machine the command is:
> python pointFoc.py
You have to have: matplotlib, numpy, MySQLdb and getpass installed on your machine.
Important
Since the script accesses Tapas directly it is secured with a password, which is the same as for the iramstaff account of the Tapas database.
Usage Instructions
This script creates a plot of the 30m pointing and focus used for observations for:
a) all scans between two dates
b) one specific project
c) one specific project between two dates.
Input variables are:
-s, --start : reads in Start Date
-e, --end : reads in End Date
-p, --project : reads in Project Name
-o, --output : reads file name to save the Plot
-f, --Format : sets the graphic format (eps, png, pdf)
-h, --help : print this help
The format for dates need to be 'Year-Month-Day', e.g. '2012-01-06'
optionally a time can be also given by 'Year-Month-Day Hour:Minute:Second',
e.g. '2012-01-06 21:56:45'; with a space in between the Date and the Time.
Projects names are the 30m names, e.g. '105-09' or 'monitoring' etc..
For a) give only start and end dates
for b) only Project Name
for c) all three parameters.
Defaults:
A plot of all pointings and focus values of the
last week is the Default if nothing is specified.
The default output file is 'plPoiFoc.eps' in eps format.
Via -o and -f name and format can be changed respectively.
Possible formats are png, eps, pdf, jpg.
Usage Examples:
(on mrt-lx3 skip python before the script name)
Case a):
> python pointFoc.py -s '2012-01-06' -e '2012-01-16'
Case b):
> python pointFoc.py -p '145-11'
Case c)
> python pointFoc.py -s '2012-01-06' -e '2012-01-16' -p '145-11'
Change plot name/path and format:
> python pointFoc.py -p '145-11' -o 'newName.png' -f 'png'
Download the Python Script
First off all you need the up-to-date version of the python script "pointFoc.py" that creates the plot. This can be downloaded here:
http://bazaar.launchpad.net/~ascurion/+junk/plPoiFoc/files
If you want you can contribute to the code via launchpad or send me changes you made so that I can include them. Any suggestions and improvements are welcome.
In case of Problems
If you get error messages and/or fail to create the plot, please check if you have the latest code. If so you may contanct me (CB, buchbend AT iram.es).
OLD Instructions
Script Revisions 4 and earlier on launchpad.
Get the Pointing results from Projects
Enter the Tapas webpage: https://mrt-lx3.iram.es/tapas/ . You'll have to log in with staff permissions to see the information of all projects. Please ask the computer group or me (CB) for the login details in case you don't know.
After logging in, go to the search form and enter the time range you want to display the pointing results for:
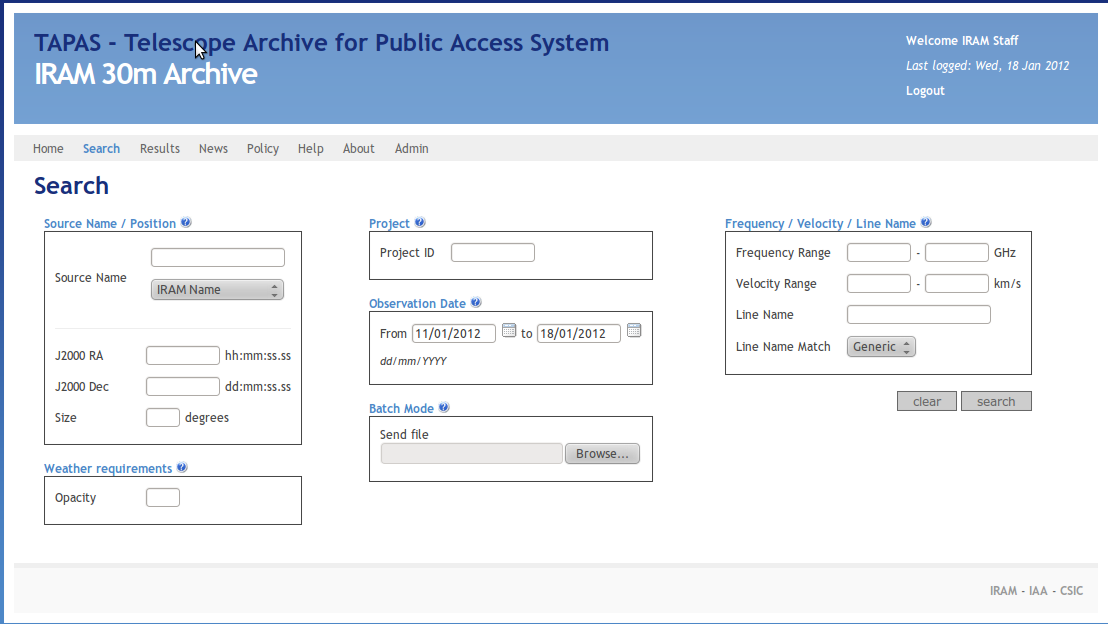
Now you'll obtain a somewhat confusing list of scans and projects that have been observed during that time:
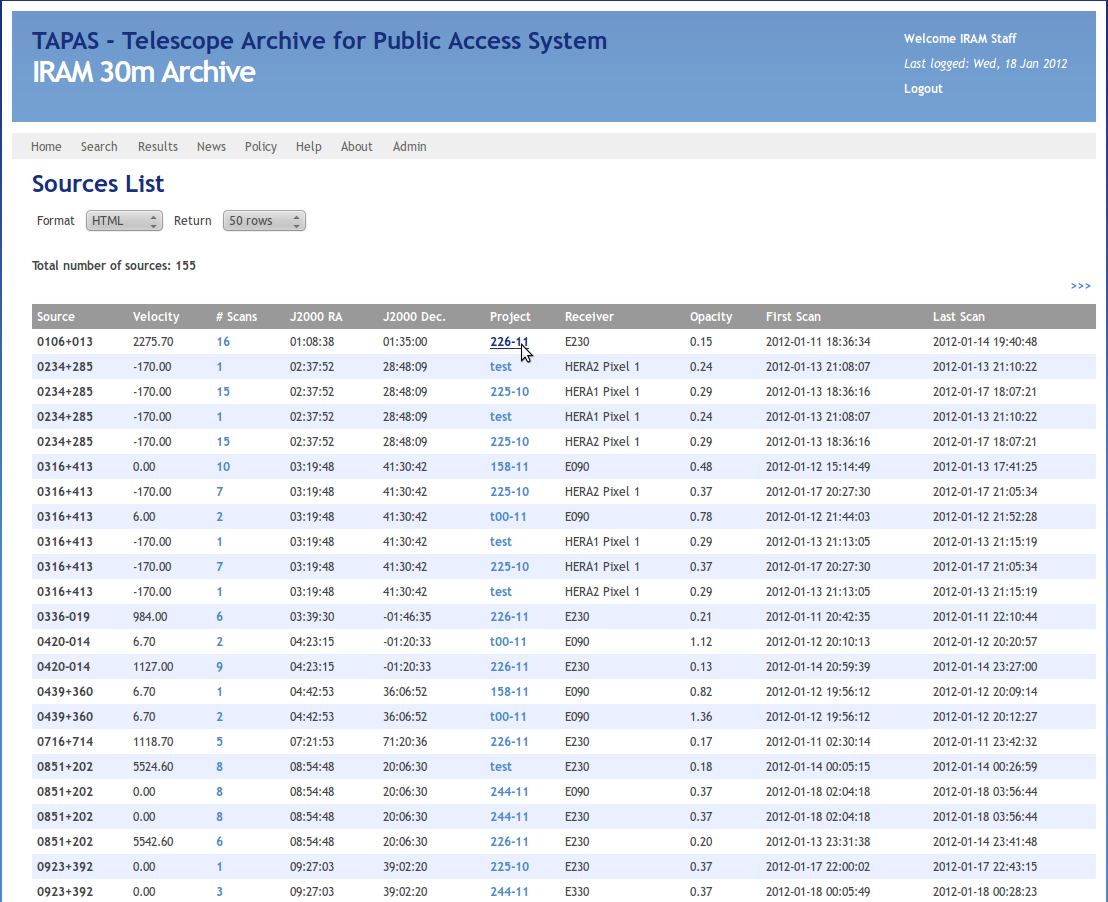
To get the pointing results and the data format the program reads you have to select one project like shown in the previous image (Project 266-11).
Clicking on a project name leads you to this page:
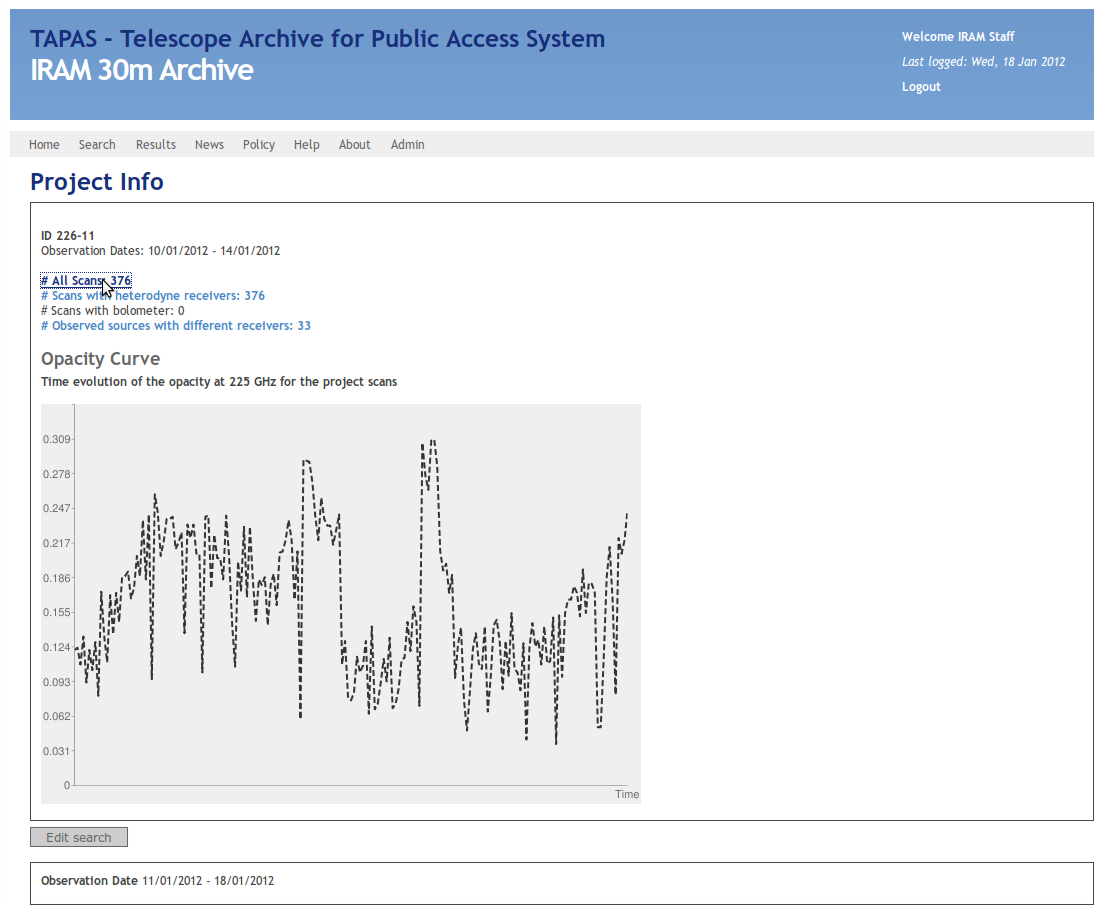
Here you have to select the link '#All Scans' like indicated in the previous image. Now you'll get a list of all scans made in this project:
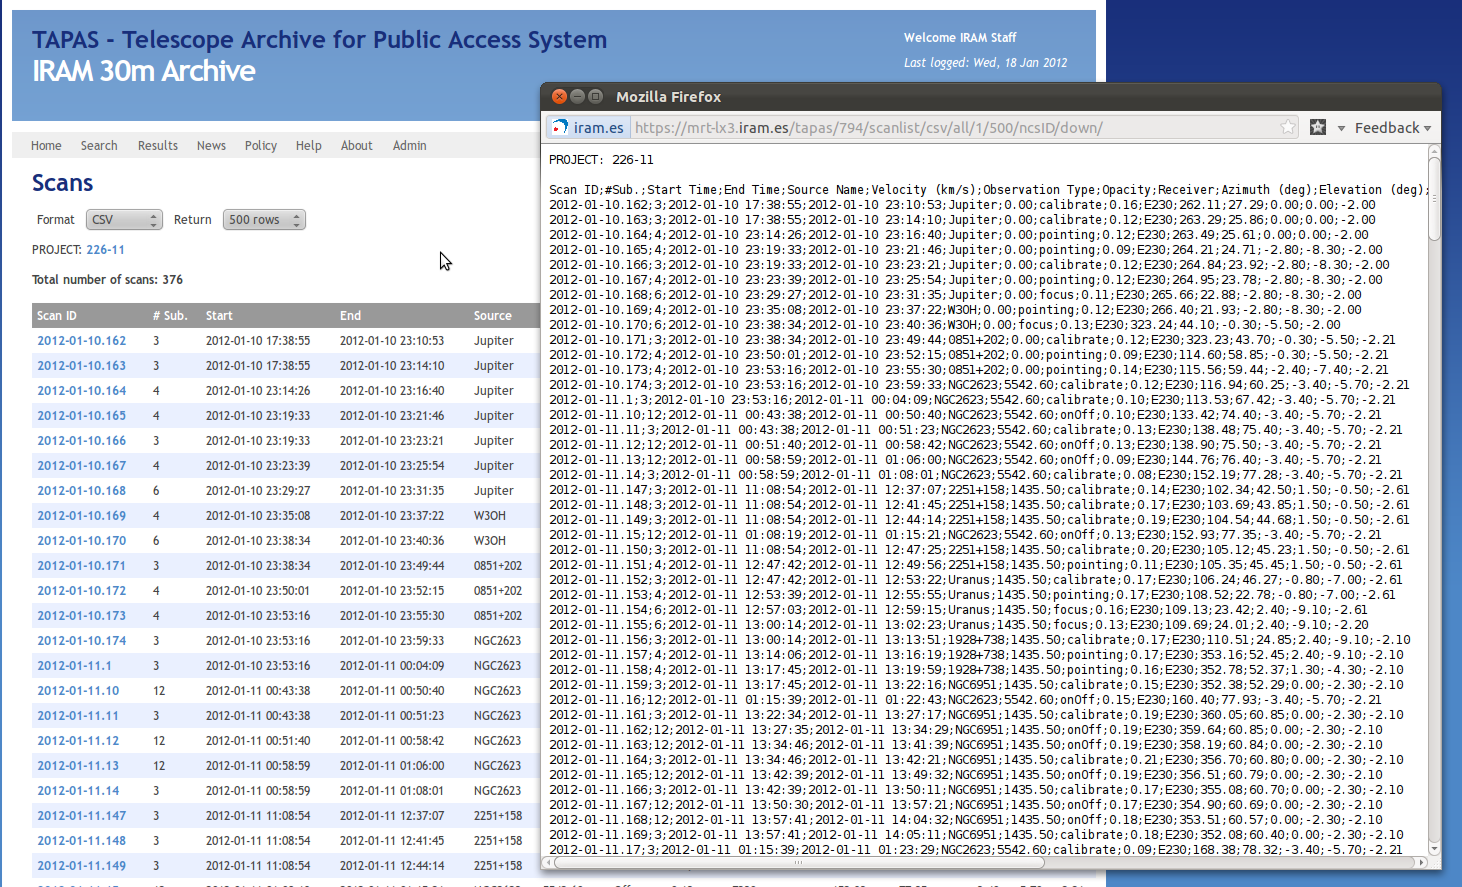
Note, that the scans may exceed the time range you have selected at the beginning, since this page displays all scans of a project. Long projects like the flux-monitoring easily cover months.
On the top of the page you can adjust the number of scans shown by changing the number of Rows. This number should always be larger than the number of total scans to assure that all scans are displayed. Finally, to get the information in the format the python script accepts you have to change "Format" to CSV. This results in the pop-up that is also displayed in the previous image.
Creating the input File for the Python Script
The information and format displayed in the CSV pop-up is what the python script expects. To get the script to work you'll need to create a text file that is called exactly:
pointFocus.txt
Please then copy the output displayed in the pop-up created by TAPAS into this text file.
Creating the Plot
Important for the script to work is that the PC that you are using has numpy and matplotlib, two python packages, installed. At the moment, without gra-lx4 available, only gra-lx18, my machine, has the right preferences, as far as I know.
Update by AS: Now the script can also be used on the mrt-aod and mrt-lx3 computers.
To create the plot, once you have the text file ready, you have thus to log into gra-lx18 and having pointFoc.py and pointFocus.txt in the same directory you need to execute in a terminal:
python pointFoc.py
This will print out the mean pointing and focus corrections on the screen and create the pointing plot named: plPoiFoc.eps in the same folder.
Plotting more than one project
To plot more than one project you just have to add the content of the CSV pop-up of the all projects to the same pointFocus.txt. Just append the new scans to the bottom of the already existing text file. The script orders the scans in time on its own. Don't worry about empty lines or lines that have not the right format since they are filtered out by the script.
