|
Size: 14137
Comment:
|
← Revision 95 as of 2009-05-26 08:24:28 ⇥
Size: 14187
Comment:
|
| Deletions are marked like this. | Additions are marked like this. |
| Line 1: | Line 1: |
| ## page was renamed from EmirCommissioningReport |
EMIR Commissioning Report
- DRAFT Version 0.2, May, 20, 2009
Authors: C.Kramer & J.Penalver
Contents
The Commissioning team: Juan Penalver, Hans Ungerechts, Helmut Wiesemeyer, Albrecht Sievers, Gabriel Paubert, Walter Brunswig, Guillermo Quintana-Lacaci, Denise Riquelme, Rebeca Aladro, Breezy Ocana, Manolo Ruiz, Melanie Krips, Sascha Trippe, Dirk Muders, Albert Greve, Clemens Thum, Karl Schuster, Carsten Kramer
Abstract. Here, we report on the results of the commissioning of the new Eight Mixer Receiver at the IRAM 30m telescope, between end of March and end of April 2009. The first results are very promising. The observed alignment between the polarisations and between the bands is better than 1 arcsec. The observed telescope efficiencies (forward, main beam, aperture) are according to expecations. Spectral line observations were conducted with all observing modes, using all spectrometers, with the exception of the 1MHz filterbank, which still needs to be commissioned.
EMIR is not only hardware. Major parts of the software had to be rewritten. This concerns the receiver control software, parts of the "New Control System" and, of course, the PaKo user interface. In addition, the entire software producing the data had to be thoroughly revised: the read-out of the spectrometers into data streams, the transformation into IMBfits raw data, and the final transformation into calibrated data on the so-called TA* scale. A very significant part of the commissioning period was spent debugging this software, addressing all kinds of frequency swaps and shifts and plenty of wrong labels.
Routine observations with EMIR started on April, 28, without encountering major obstacles since then.
Related documents available on request:
EMIR Installation report
by Jean-Yves Chenu, A.L. Fontana, B.Lazareff, P.Pissard, D.John, J.Penalver, and Santiago Navarro (2.4.2009, V1.0)EMIR receiver characterization in the laboratory
by A.L.Fontana (3/2009)EMIR Draft Users Guide
http://www.iram.es/IRAMES/mainWiki/EmirforAstronomers
Continuum Observations
Continuum backends
At present, only the central 1GHz of each 4GHz chunk are being used for continuum detection. Broad band 4GHz wide continuum detectors are in preparation.
Nasmyth Offsets
EMIR has two beams seperated by 90arcsec on the sky. Several pointing sessions were conducted to determine the Nasmyth offsets to be -39.0"/+5.5" for the right beam and +51.0"/+5.5" for the left beam. Each pointing session consists of observations of several dozen of point sources distributed over the sky. The right beam is used for single band E0 or E2 observations, and for dual band E0/E2 and E0/E1 observations. The left beam is used for E1, E3, E1/E3. At present, the observer has to set the Nasmyth offsets in PaKo. They are not yet set automatically when switching the EMIR setup.
Alignment
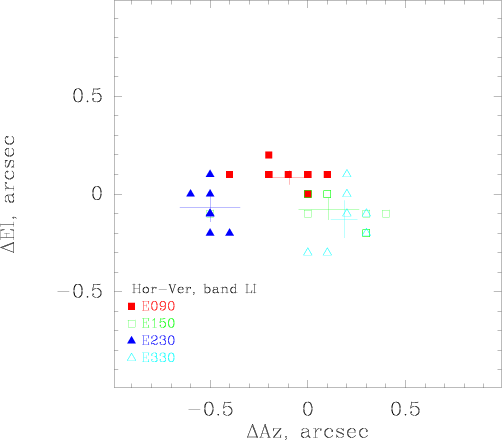
The above figure shows the alignment between the four EMIR bands and between the two polarisations of each band. The overall alignment is better than 1 arcsec.
Foci
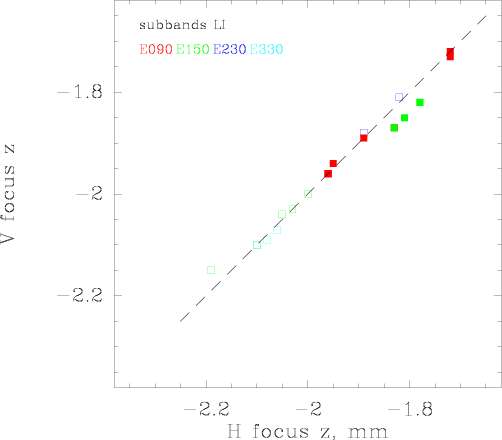
The above figure shows the focus between different polarisations of the same band. There are no significant differences between these foci.
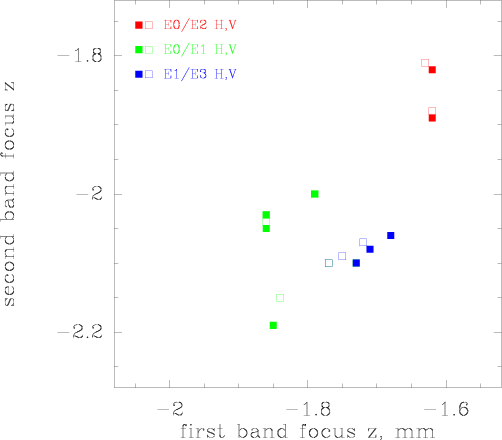
This figure shows the focus between different bands. The largest deviation is about 0.3 mm, similar to the situation with the ABCD receivers. For dual band observations, the telescope should be focussed to the high frequency band.
We also made focus scans in lateral (x, y) directions, however, with inconclusive results. The observed telescope efficiencies indicate that the telescope is well focussed.
Telescope Efficiencies
Freq
HPBW
Feff
Beff
Aeff
S/TA*
Comments
GHz
arcsec
%
%
%
Jy/K
86
29
95
81
63
5.9
4.4.
145
16
93
74
57
6.4
4.4.
210
11
94
63
49
7.5
29.3.
260
9
88
53
41
8.4
29.3.
330
7
86
32
29
12.0
4.4.
The main beam and aperture efficiencies, and the beam widths, were derived from Mars observations. The observations on April, 4th, were conducted at an elevation of 43 deg, i.e. near the maximum of the gain elevation curve. The observations on March, 29th, were conducted at elevations between 29deg and 44deg. The ellipticity of the beams is better than 90% in all cases. Mars was pointlike with a diameter of 4arcsec.
The forward efficiencies were derived from Skydips. All skydip observations conducted in the week before Apr, 1st, resulted in the following efficiencies:
band
freq.(GHz)
Feff
E0
86, 98
95
E1 (with E0)
147
92
E1 (with E3)
145, 147
95
E2
210, 230
94
E2
260
88
E3
330
86
The analysis of the skydips was done manually. The atmospheric temperature Tatm was derived with the program ATM. The agreement between the atmospheric opacity derived from the skydips and those determined by the standard (chopper-wheel) calibration, agree very well. At present, it is not clear whether the slight 3% difference in forward efficienciers found between observations with band E1 together with E0, or together with E3, i.e. with different dichroics, is significant or not.
Errorbeam observations
We conducted total power scans across the full moon to study the telescope error beams. The results agree with results previously obtained with the ABCD receivers, as expected.
Pointing & Flux monitoring
Pointing scans were conducted in the traditional beam switching mode, in wobbler switching mode, and in total power mode. Under very good atmospheric conditions, the total power mode produced very good results. The beam switching mode suffered from spikes, a problem which is already known from the ABCD receivers. This will be tackled, otherwise wobbler switching may be the more efficient observing mode.
Spectral line observations
Spectrometers
During commissioning, we used the 4MHz filterbank and the two auto correlator backends WILMA and VESPA, partly in parallel. The 1MHz filterbank will be commissioned asap.
A variety of VESPA setups were checked, covering the range of resolutions between 3kHz and 1.25MHz and a wide range of bandwidths. VESPA parallel mode was also checked. However, as a reminder, it is not possible to check all possible setups. A tool to validate the selected VESPA setup in PaKo has been implemented.
Observing modes
The following switching modes were re-commissioned: position switching (onoff), wobbler switching, and frequency switching. Beam switching was checked using the continuum backends. The on-the-fly mapping mode was re-commissioned, in combination with position switching and with frequency switching.
EMIR setups
The following EMIR setups were requested in the proposals for this summer semester and have been commissioned. The Code corresponds to the table created by S.Navarro describing possible setups of the switch box BAND_COMBINATIONS.pdf. The listed Bandwidth is the total bandwidth covered by the resulting spectra, given to about 0.5GHz accuracy.
Band(s)
Sidebands
Polarisations
Bandwidth
Code
E0
1SB
H/V
8GHz
(13)
E0
2SBs
one pol.
16GHz
(14)
E0/E1
1SB
H/V
8GHz
(121)
E0/E2
1SB
H/V
8GHz
(131)
E0(8GHz)/E2
1SB
mixed
12GHz
(135)
E1
1SB
H/V
4GHz
(2)
E2
1SB
H/V
4GHz
(3)
The following Figure shows the frequencies of the band edges and centers of the lower and upper sidebands, and the inner and outer bands. Note that the band edges and center are not exactly at multiples of 2GHz relative to the local oscillator. This is due to the IF distribution. The backends are centered near the band centers. VESPA is centered at 6.25 or 9.43GHz. For WILMA, the inner and outer bands have 0.1GHz overlap. The inner band runs from 4.125 to 7.845GHz. The outer band runs from 7.835 to 11.555GHz.

Band Edges
We checked that the following band edges (center of 4GHz IF) can be reached:
- E0: 78-117
- E1: 129.6-174
- E2: 201-267
- E3: 260-?
Comments:
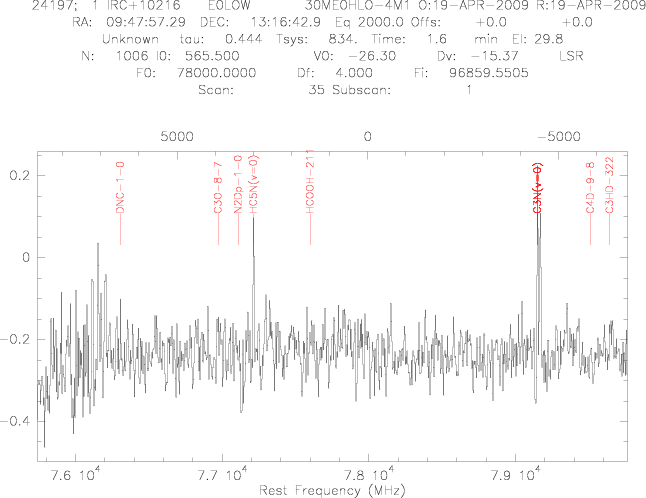
- We tuned the lower outer band of the 3mm receiver to a center frequency of 78GHz, without difficulties. The receiver noise temperature rises to ~200K at the band edge near 76GHz. This setup allows to observe e.g. the N2D+(1-0) or the DNC(1-0) transitions. Trying to tune to still lower frequencies, the receiver temperature rapidly rises to several 1000K. The following image shows a spectrum of IRC+10216 taken at 78GHz.
E150 was tuned 129.6 GHz LI. The Trx obtained were ~ 36-32 K (Wilma & Vespa).
Ripples and spurious signals
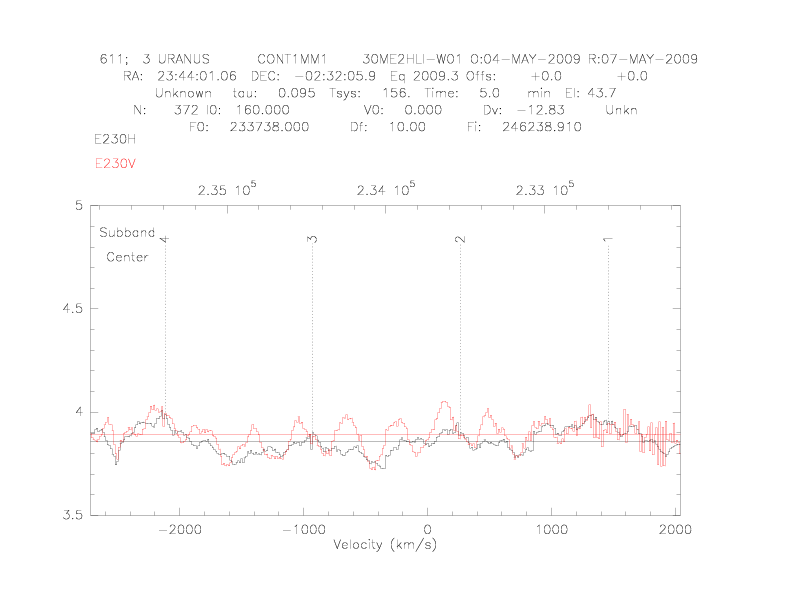
- Spectra taken on Uranus near 233GHz show standing waves, similar for both polarisations, on a baseline offsets due to the continuum of 3.9K TA*. A fft analysis indicates that the major ripple frequencies are 140, 310, 1000MHz. This corresponds to about 1m, 0.5m, and 15cm cavity length. Spectra taken on Callisto and Neptune confirm these typical ripple frequencies. More importantly, amplitude and phase stay constant over a period of more than 20minutes. (Based on an analysis contributed by Raphael Moreno, 7.5.09).
Receiver gain ratios
In the receiver lab in Grenoble, the image gain had been measured for the 2SB mixers (bands 1 & 4). For the SSB mixers (bands 2 & 3) then gain was optimized. It is definitely better than -10dB at the center of IF, possibly worse at edges of 4GHz band.
The default receiver gain ratio in PaKo has been set to -13dB for all receiver bands. The maximum error on the antenna temperature scale, introduced by a variation between -10dB and infinity, is 5%.
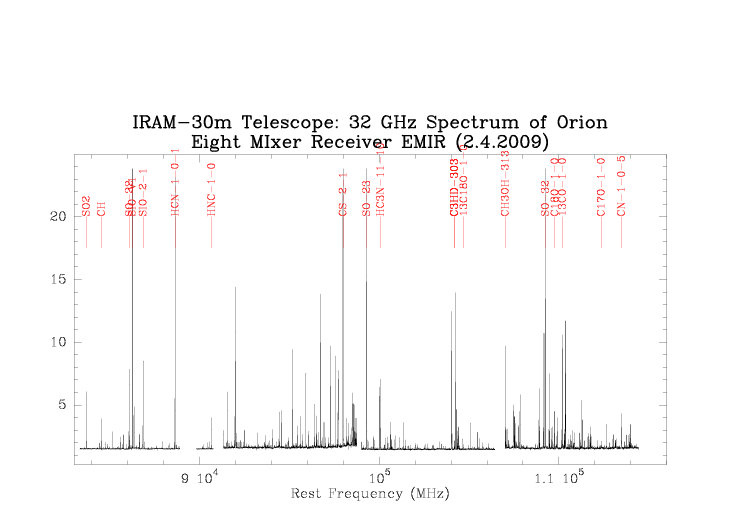
- During commissioning, the gain ratio was measured only once: The 12CO 1-0 line in IRC+101216 showed up in the lower sideband, at 102.772, reduced by a factor of 24, corresponding to a gain ratio of -13.8dB. This shows the potential of frequency surveys, like the one conducted on Ori IRc2 shown below, to measure the variation of the gain ratio over the band pass, similar to what has been done for lab spectra taken with HIFI.
Status of Band 4 commissioning
- E3 lower band tuning was checked (260GHz). It was possible to tune it, but changing the harmonic mixer bias was needed. The Trx obtained were ~60-65K at LI band.
- Telescope efficiencies were measured at 330GHz (see above).
- The Local Oscillator lacks power above about 340GHz and will be replaced.
- The variation of aperture efficiency with elevation is the strongest in Band 4. In August/September 2009, Mars will rise to above 70deg, and will stay small, allowing to measure accurately the gain elevation curve.
Science verification
- The following figure shows a spectrum of Orion IRc2 covering 32GHz of the 3mm window. It was taken with WILMA in wobbler switched mode in two EMIR setups in 30minutes of on+off observing time. Each EMIR setup used 16GHz simultaneously, both sidebands, with one polarisation. One broken WILMA unit was later repaired. The 4MHz/8GHz Filterbank was used in parallel, but data are not shown here.
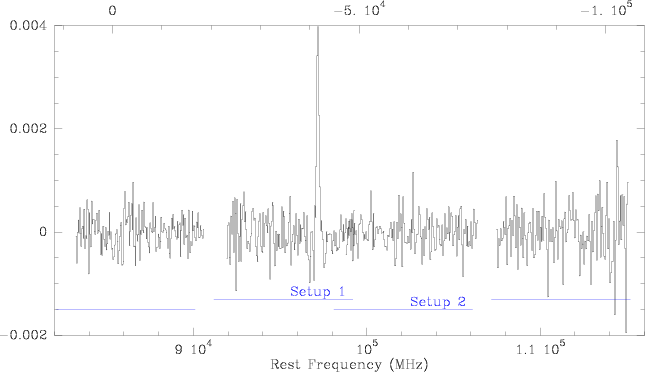
- A long 4 hour integration of the Cloverleaf, a quasar at high redshift, in the 3mm window, resulted in flat baselines with 0.4mK at 150km/s resolution. For this, we used WILMA in wobbler switching mode. The redshifted CO 3-2 line is confirmed.
Remaining steps
- A number of smaller items, left over from commissioning, will be addressed in the coming weeks, and are not listed here.
- In mid June 2009, four new remotely controlled synthesizers will be installed. So far we have however been working with two synthesizers in the receiver cabin, causing a number of problems. The operators have to switch cables to the synthesizers in the receiver cabin, when changing the EMIR setups. With the present synthesizers, the harmonic mixer power often need to be reduced relative to the tabulated values, to avoid locking onto a harmonic at plus or minus 50MHz. We have the suspicion that slight frequency changes cause the present synthesizers to loose lock for a brief period of time. All these problems should be solved with the new set of synthesizers.
- It is planned to commission the 1MHz/1GHz filterbank as soon as possible.
Polarimetry with EMIR shall be commissioned in mid June 2009. VESPA will be used in cross-correlation mode, as before. Phase calibrations will be done with a polarizer in front of an external cold load.
- The band 4 Local Oscillator will be replaced.
- The power slope in band 1 will be improved by new equalizers which are currently built in Grenoble. The aim is to reduce the slope from about 11dB to 7dB.
- At present, NCS still uses an old atmospheric model ATM, which includes only atmospheric water and oxygen lines. Lines of e.g. Ozone, are missing (cf. Figure 1). Implementation of a new model is in preparation.
