|
Size: 2277
Comment:
|
Size: 2203
Comment:
|
| Deletions are marked like this. | Additions are marked like this. |
| Line 6: | Line 6: |
'''Pixels:''' pitch 1.6x1.6mm. 224 pixels on design (12x12 array minus the corners). About 190 useful pixels. |
|
| Line 15: | Line 17: |
| ''Figures: Response spectrum measured in Grenoble on the 240GHz array used for run4-5-6.'' | ''Figure: Response spectrum measured in Grenoble on the 240GHz array used for run4-5-6.'' Please find below the data for the spectrum on the pixel 1 (frequency(GHz), Response (AU)): |
| Line 22: | Line 26: |
'''Pixels:''' pitch 2.3x2.3mm. 132 pixels on design (12x12 array minus the corners). 129 identified resonances, at least 125 useful pixels. |
|
| Line 31: | Line 37: |
| ''Figures: Response spectrum measured in Grenoble on the 150GHz array used for run 6.'' | ''Figure: Response spectrum measured in Grenoble on the 150GHz array used for run 6 (FWHM=135-170GHz).'' |
| Line 33: | Line 39: |
| Please find below the data for the spectrum on the pixel 1: | Please find below the data for the spectrum on the pixel 1 (frequency(GHz), Response (AU)): |
| Line 92: | Line 98: |
204.32,317.1 207.84,238.82 211.37,316.93 214.89,170.24 218.41,617.32 221.94,63.273 225.46,499.46 228.98,163.21 232.5,228.39 236.03,343.25 239.55,565.84 243.07,227.31 246.59,272.68 250.12,318.12 253.64,345.76 257.16,221.96 260.69,606.71 264.21,466.14 267.73,995.97 271.25,850.49 274.78,993.05 278.3,604.95 281.82,899.67 285.35,756.18 288.87,1137.6 292.39,986.84 295.91,1481.8 299.44,1809.9 |
240 GHz band
Array: unchanged, still NICA 8e, 20nm Al IRAM. LO 1.95GHz, power per tone -50dBm (at cryostat input).
Pixels: pitch 1.6x1.6mm. 224 pixels on design (12x12 array minus the corners). About 190 useful pixels.
Cold electronics: SiGe Caltech amplifier "Florence" (gain 40dB, 1dB compression point 0dBm integrated power).
Warm electronics: NIKEL01. RF source 192.168.1.196 (IFR 2024 Leasametric). 0dB attenuation at cryo IN. DAC 2, niv 3. VLF2500 low-pass filter at cryostat input.
Spectrum: peaking at 240 GHz.
Figure: Response spectrum measured in Grenoble on the 240GHz array used for run4-5-6.
Please find below the data for the spectrum on the pixel 1 (frequency(GHz), Response (AU)):
150 GHz band
Array: NICA8f1, 18nm Al film made at IEF, litho PTA. LO 1.35GHz, power per tone -54dBm (at cryostat input).
Pixels: pitch 2.3x2.3mm. 132 pixels on design (12x12 array minus the corners). 129 identified resonances, at least 125 useful pixels.
Cold electronics: SiGe Caltech amplifier SN 84 (unchanged, (gain 40dB, 1dB compression point 0dBm integrated power).
Warm electronics: NIKEL02, RF source 192.168.1.192 (IFR 2025 IRAM), 3dB attenuation at cryo IN, starting DAC 2, niv 3. VLF2250 at cryostat input.
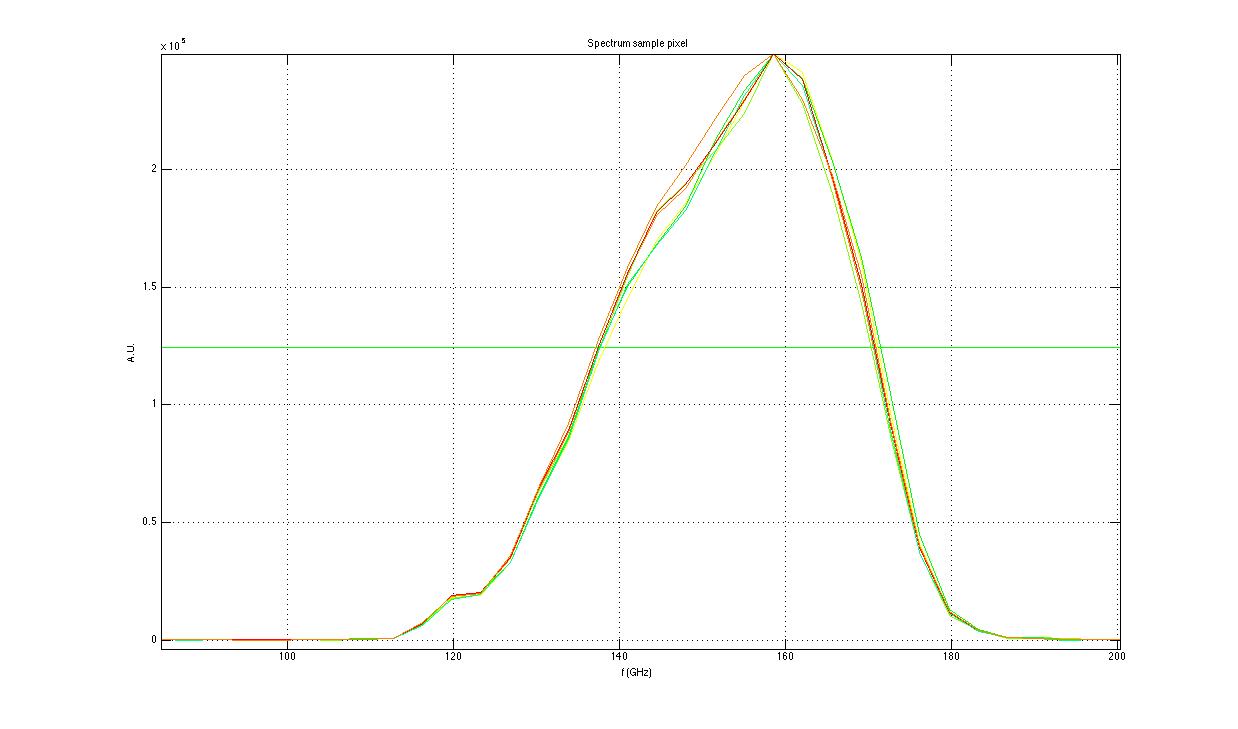
Spectrum: peaking at 155 GHz.

Figure: Response spectrum measured in Grenoble on the 150GHz array used for run 6 (FWHM=135-170GHz).
Please find below the data for the spectrum on the pixel 1 (frequency(GHz), Response (AU)):
102.16,449.8
105.68,364.14
109.21,790.38
112.73,860.81
116.25,7672.5
119.77,18558
123.3,20032
126.82,36197
130.34,65947
133.87,92085
137.39,1.2775e+05
140.91,1.5821e+05
144.43,1.8406e+05
147.96,2.0142e+05
151.48,2.217e+05
155,2.4001e+05
158.53,2.49e+05
162.05,2.2948e+05
165.57,1.9754e+05
169.09,1.5482e+05
172.62,93405
176.14,40109
179.66,12269
183.18,4264
186.71,1265
190.23,863.01
193.75,412.25
197.28,258.72
200.8,317.51
