|
Size: 21594
Comment:
|
Size: 21549
Comment:
|
| Deletions are marked like this. | Additions are marked like this. |
| Line 17: | Line 17: |
| For array2, it can be seen that the most extreme focus difference on January 24 (blue) is +0.27 - (-0.89)= 1.16 mm between positions that are about opposite along a diameter. Between these same two positions, but on the next day, the focus difference is +0.1 -(-0.77) = 0.87 millimeter. This is approximately the same as the day before and the slight mismatch might come from a slight drift of the focus with time during the observation that was different at the two dates. Looking at the focus differences between the other positions lead to believe that the focus variation across array 2 is more complexe than just a gradient. Inspection of array1 and 3 in figure above shows that focus variation across these two arrays are less severe ; on the January 24th the largest difference is +0.4 - (-0.24) = 0.28 mm for array 1 and is +0.09 - (-0.20) = 0.29 mm for array 3. It is noticeable that this largest difference is between the same positions on the two independent arrays. If not by chance, this might be a clue of "something". |
For array2, it can be seen that the most extreme focus difference on January 24 (blue) is +0.27 - (-0.89)= 1.16 mm between two positions that are about opposite along a diameter. On the next day, the focus difference is +0.1 -(-0.77) = 0.87 millimeter between these same two positions. It seems that the slight mismatch comes from a small but different drift of the focus with time during the observations at the two dates. Inspection of the focus differences between the other positions indicates that the focus variation across array 2 is more complexe than just a gradient. Inspection of array1 and 3 in figures above shows that focus variation across these two arrays are less severe ; on the January 24th the largest difference is +0.4 - (-0.24) = 0.28 mm for array 1 and is +0.09 - (-0.20) = 0.29 mm for array 3. Still, it is noticeable that this largest difference is between the same positions on the two independent arrays. If not by chance, this might be a clue of "something". |
Back to the NIKA2 run 3 main page
Contents
- January 2016, 28 (Thursday)
- January 2016, 27 (Wednesday)
- January 2016, 26 (Tuesday)
- January 2016, 25 (Monday)
- January 2016, 24 (Sunday)
- January 2016, 23 (Saturday)
- January 2016, 22 (Friday)
- January 2016, 21 (Thursday)
- January 2016, 20 (Wednesday)
- January 2016, 19 (Tuesday)
- January 2016, 18 (Monday)
- January 2016, 17 (Sunday)
- January 2016, 16 (Saturday)
- January 2016, 15 (Friday)
- January 2016, 14 (Thursday)
- January 2016, 14 (Thursday)
- January 2016, 13 (Wednesday)
- January 2016, 12 (Tuesday)
January 2016, 28 (Thursday)
Characterization of the focus across the arrays.
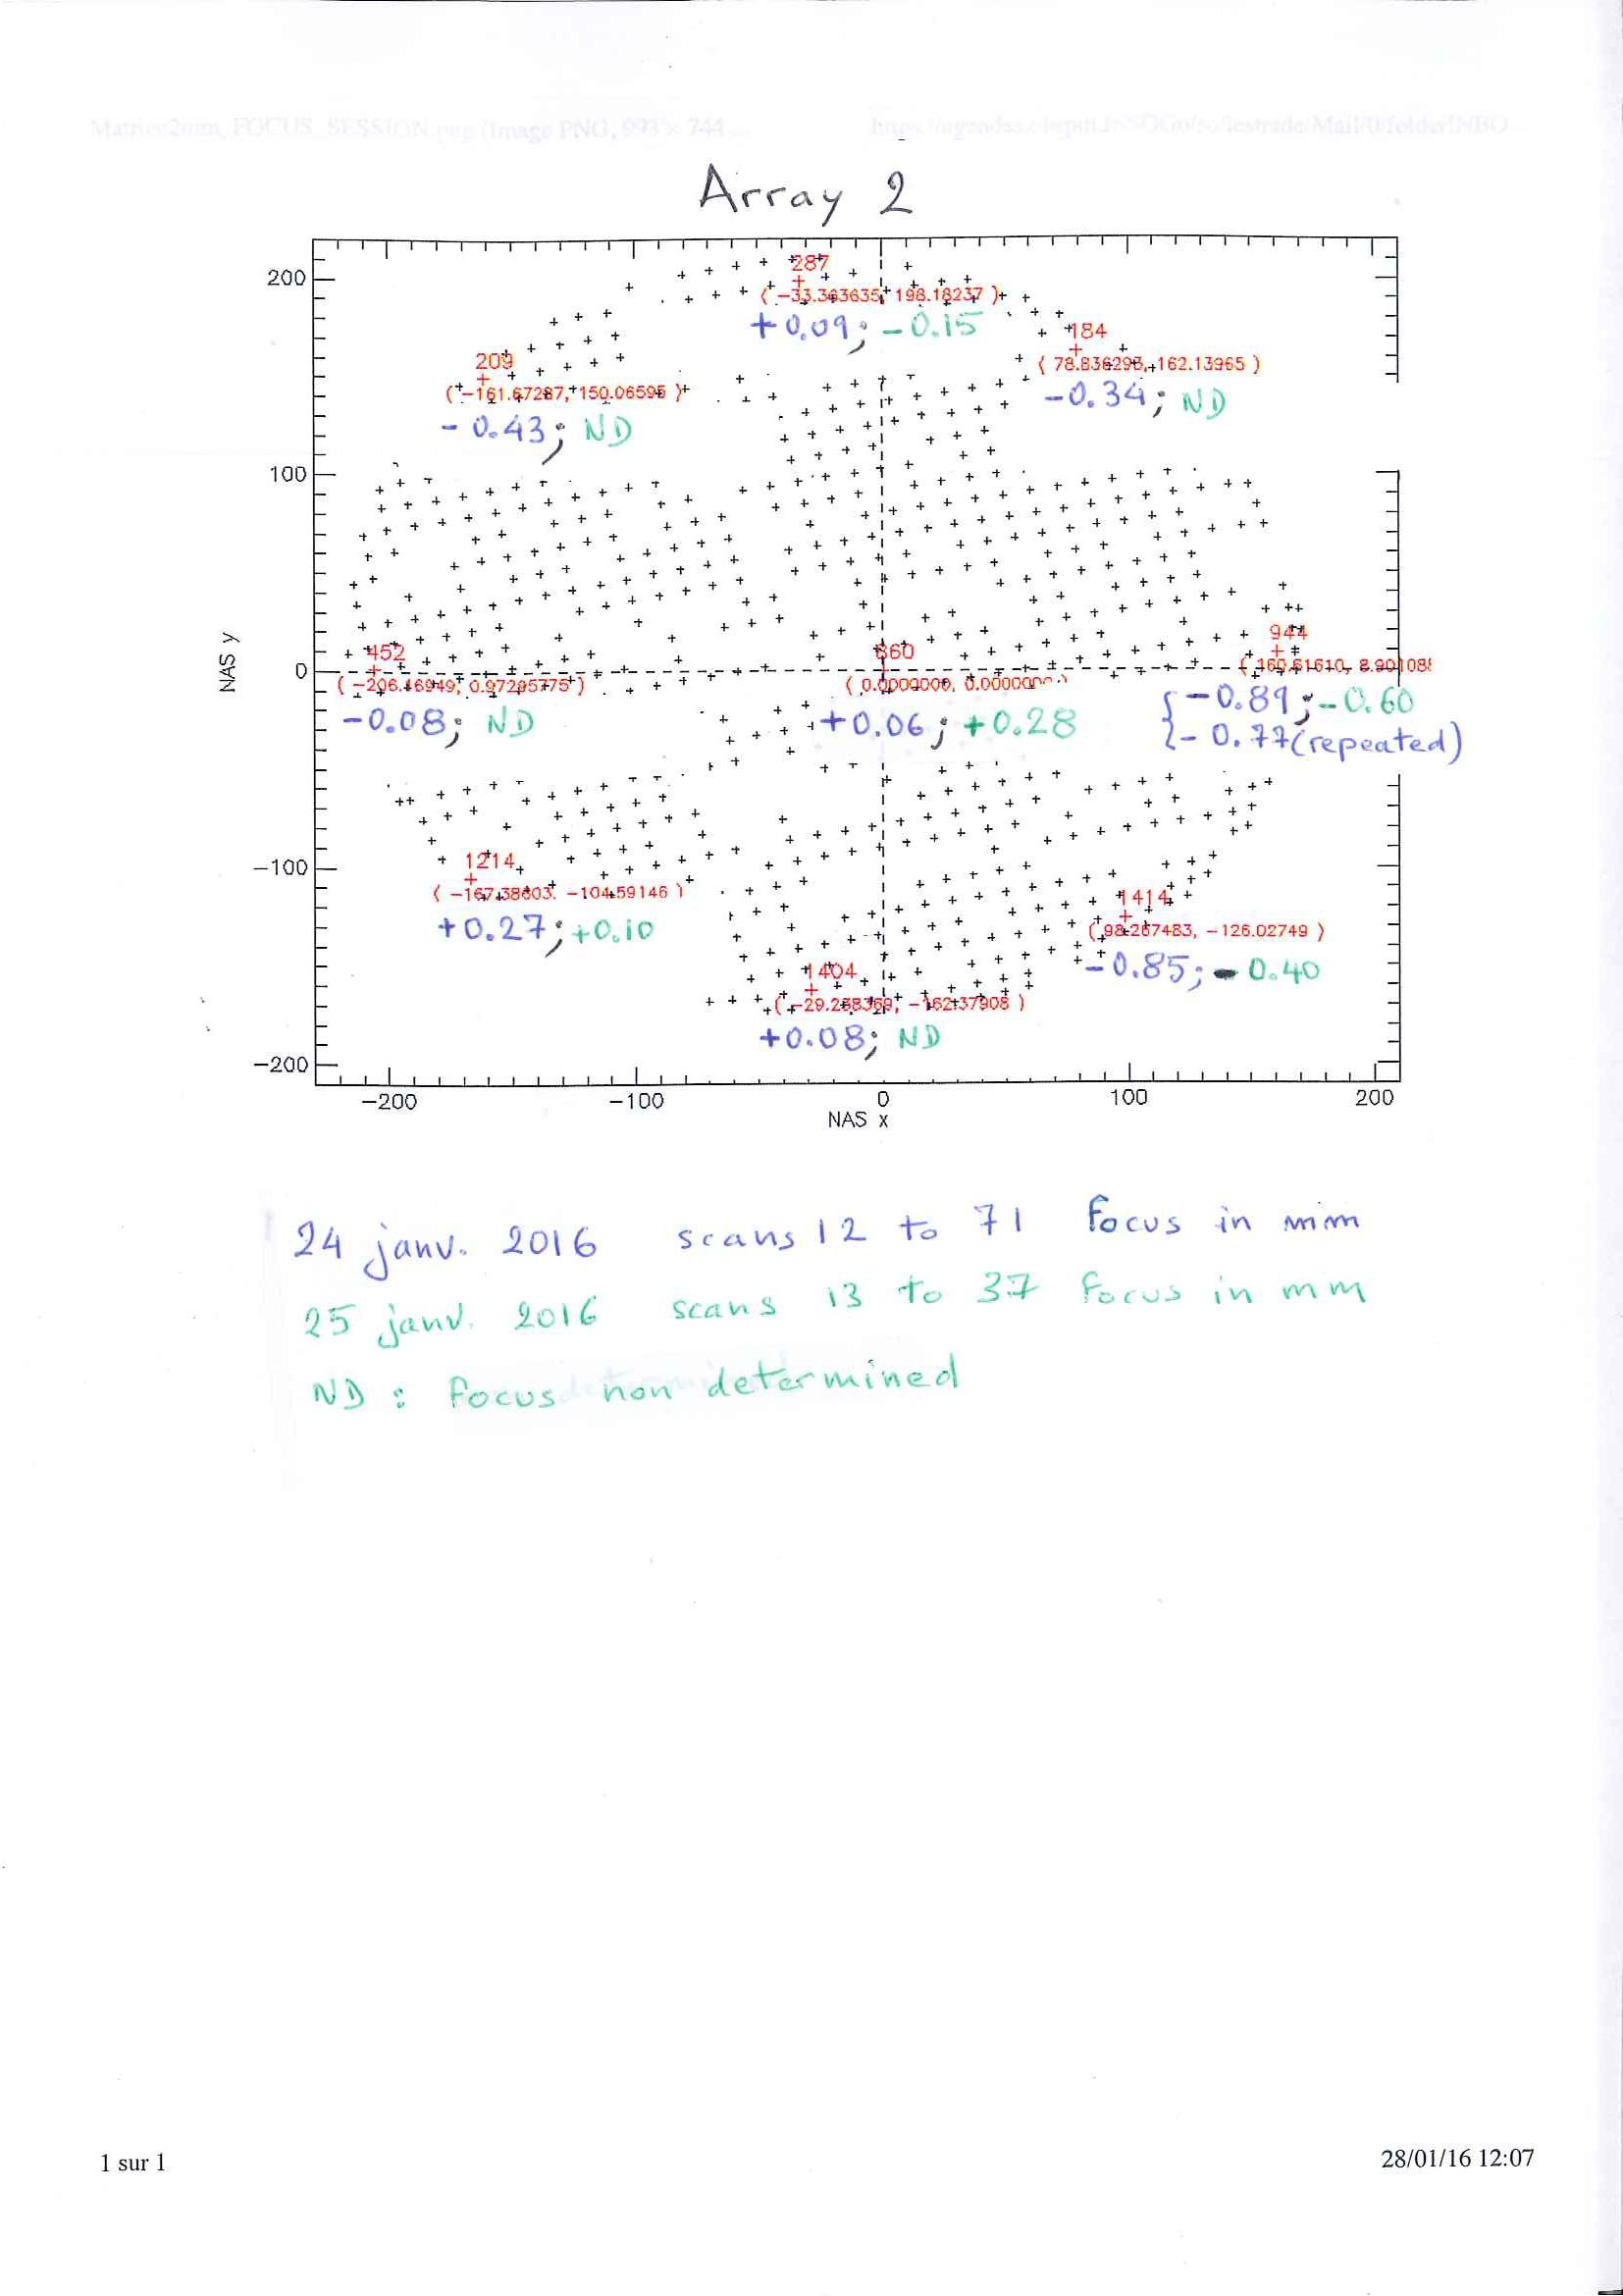
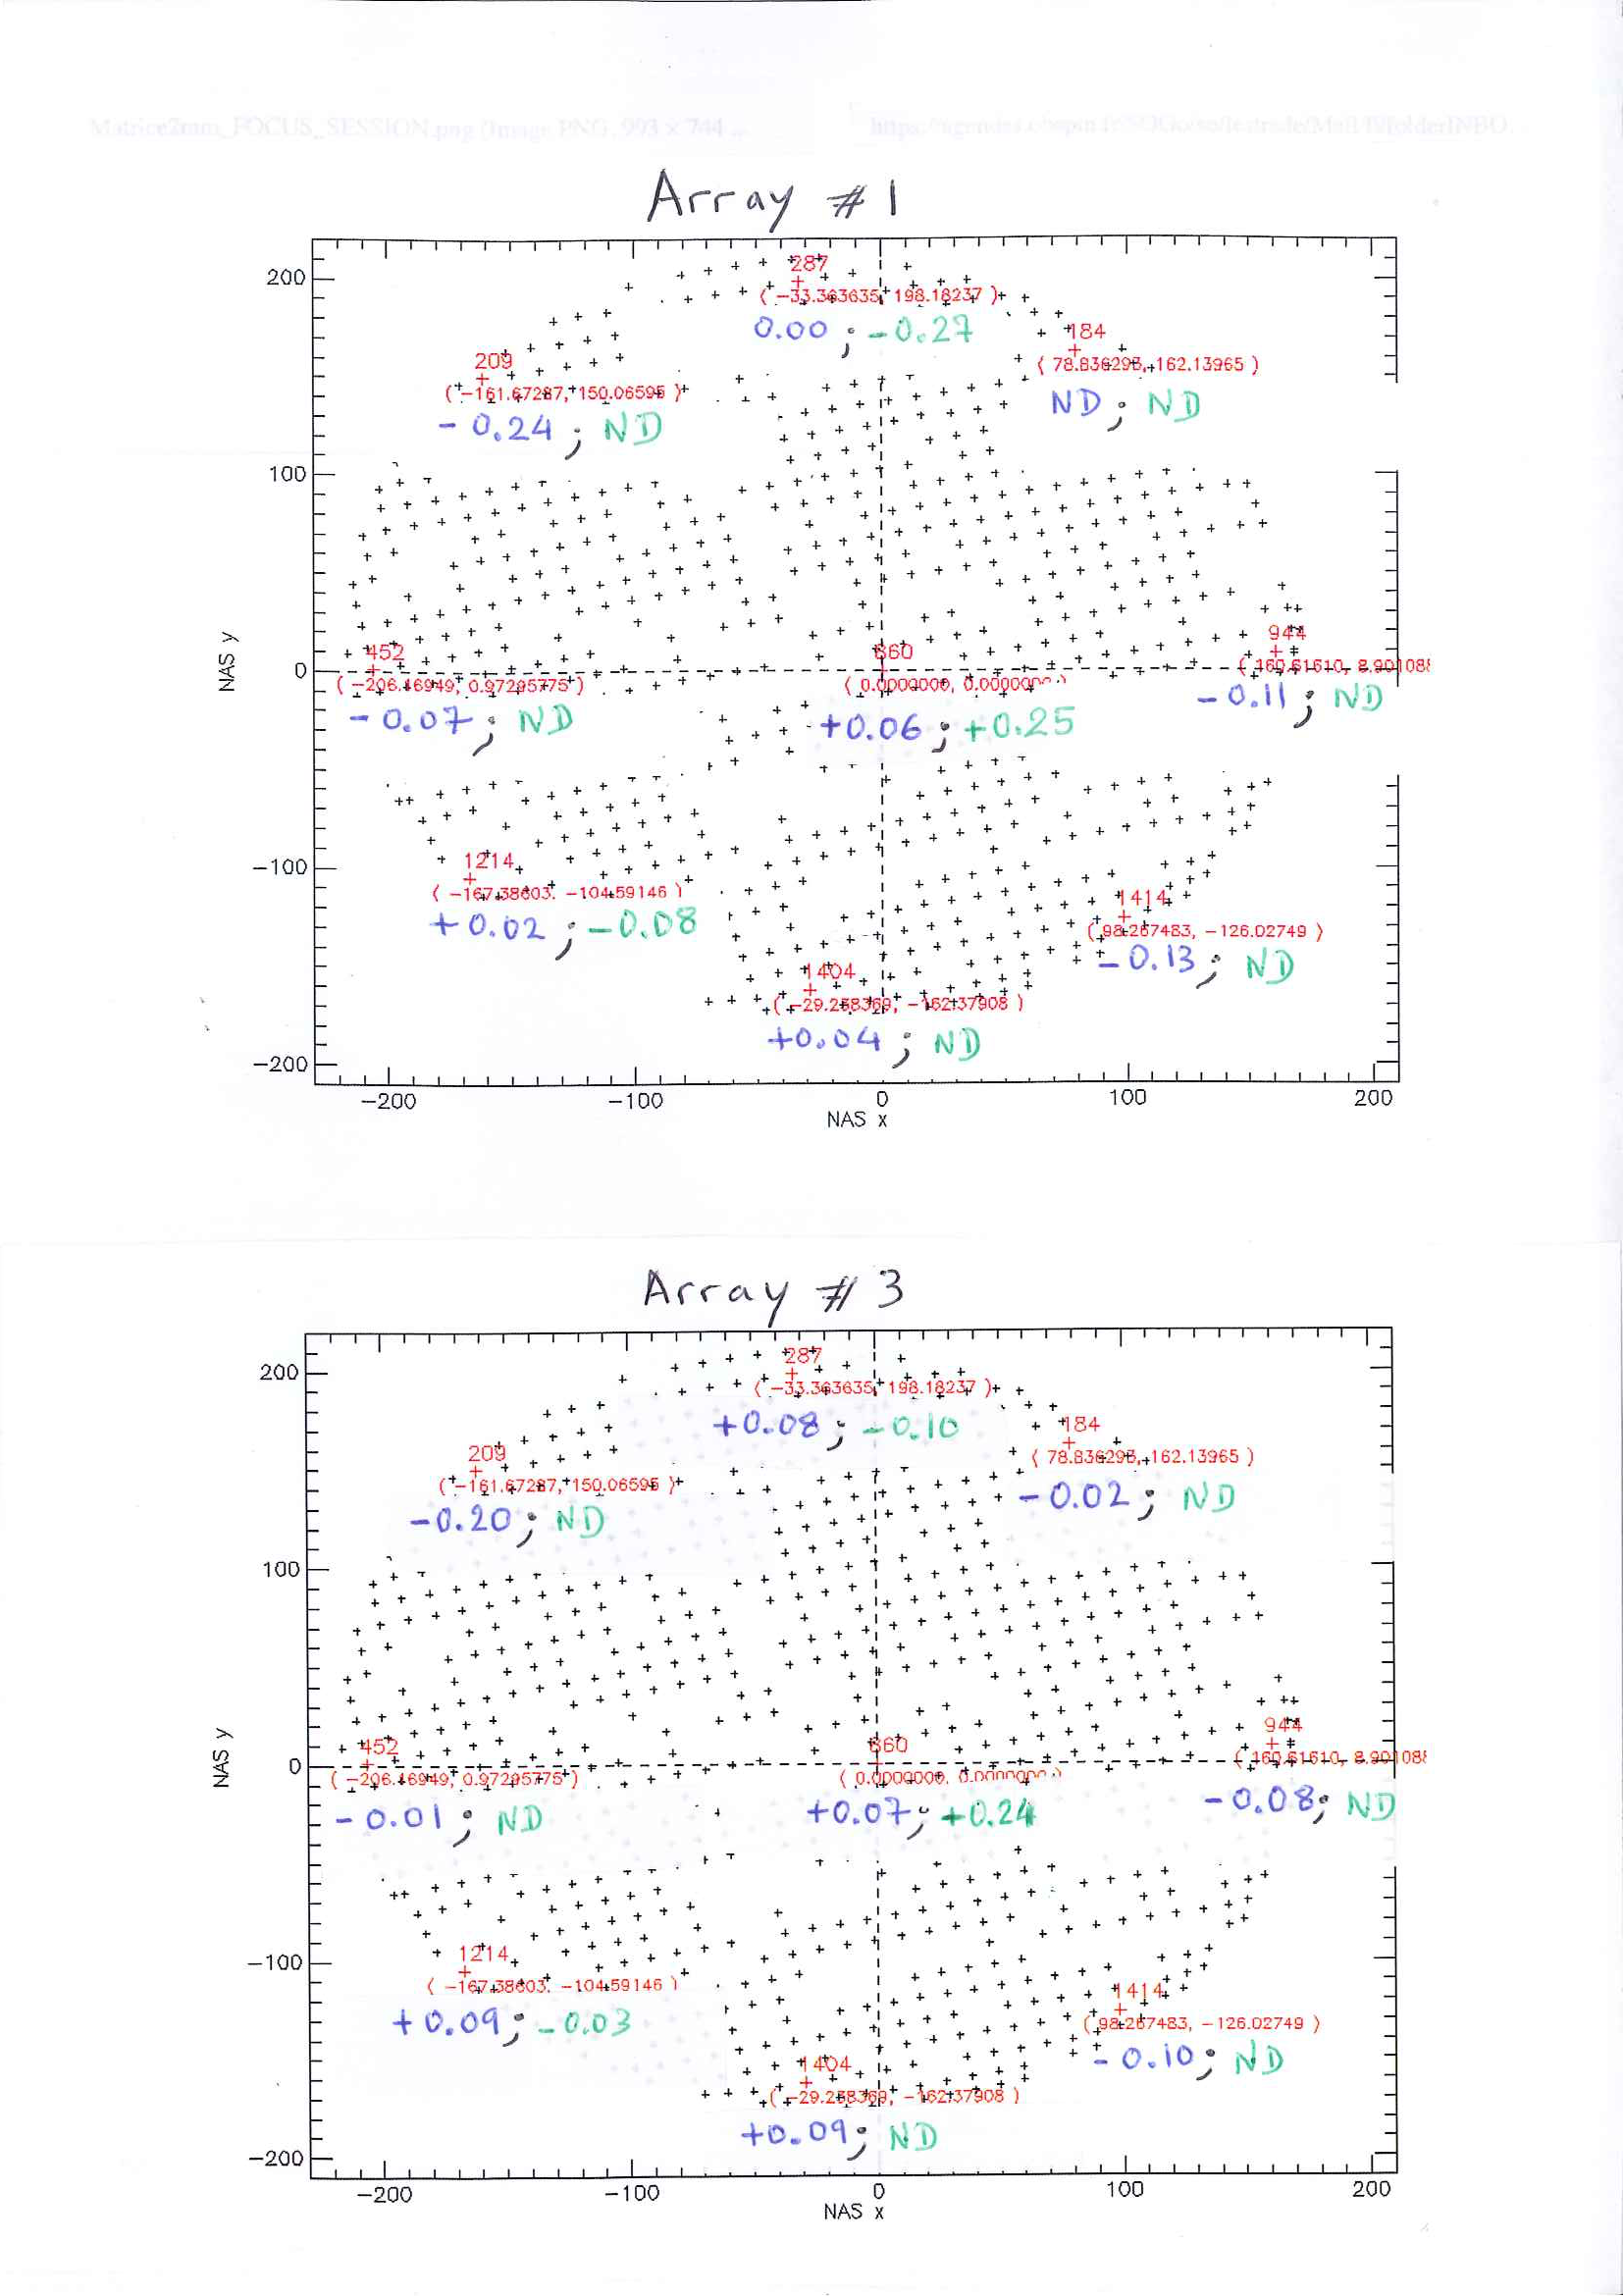
In figures above, for each array, focuses are given at the center and at several positions along the edge. They are handwritten in blue for January 24th, and in green for January 25th, and were measured in millimeter. The nasmyth offsets used to put the optical axis of the telescope at these positions are printed in red and the corresponding KID number is also provided.
For array2, it can be seen that the most extreme focus difference on January 24 (blue) is +0.27 - (-0.89)= 1.16 mm between two positions that are about opposite along a diameter. On the next day, the focus difference is +0.1 -(-0.77) = 0.87 millimeter between these same two positions. It seems that the slight mismatch comes from a small but different drift of the focus with time during the observations at the two dates. Inspection of the focus differences between the other positions indicates that the focus variation across array 2 is more complexe than just a gradient.
Inspection of array1 and 3 in figures above shows that focus variation across these two arrays are less severe ; on the January 24th the largest difference is +0.4 - (-0.24) = 0.28 mm for array 1 and is +0.09 - (-0.20) = 0.29 mm for array 3. Still, it is noticeable that this largest difference is between the same positions on the two independent arrays. If not by chance, this might be a clue of "something".
January 2016, 27 (Wednesday)
EMIR from 8 to 15h everyday from now on.
Telescope was not responding when we started. Some big intermediate files and processes were saturated NCS. Investigation and solving the problem with complete reboot of the telescope took ~2h.
Yesterday, we investigated the problem of the systematic big pointing offsets we had to enter into PaKo. With a correct pointing model they should have been around 0. Juan and Albrecht found that the pointing model parameter file was correct in NCS (mrt-lx1) but not in the AMD (antenna mount drive [control of antenna gear boxes]). Besides the pointing model that Juan had calculated previously was probably not ideal (unexpected big Az param change, and session done with a Nasmyth offset based on a unique scan). So we decided to redo a not too long new pointing session, starting afresh from the last good EMIR model, using Nasmyh 0 0 during the session, and correcting only the Nasmyth offset into the new pointing model calculated at the end. It was corerctly implemented this time, and now the pointing offset are around 0 as expected.
After passing by a secondary calibrator, skydip, and beammap on 3C83 (a try for time when we don't have planets), we do another focus session (focus on various positions of the image plane to investigate its distortion, in particular to confirm the effect of the dichroic).
A new pointing model for NIKA2 was implemented. In fact it is a pointing model with the same parameters as for EMIR but with the Nasmyth offsets HOR: +27.42" and VER: -6.39". For the fit of the new pointing model 21 pointing scans were used. The scatter rms improved from 7.5" to 2.0 ". The new pointing model for NIKA2 is valid since 27-Jan-2016 scan 184. (JP) (see also summary of pointing sessions.)
January 2016, 26 (Tuesday)
Many changes in the team: Alessandro, Laurence, Juan S., Jean François left, Barbara, Andrea B., Yoshito arrived.
Juan found the problem that led to the loss of connection with M2: some components of the M2 backend were completely burned! (see picture). The intervention implied the total dismounting of the M2 mirror, which gave us the opportunity to see it in a pretty unusual position.
We could restart observation only at 19h30, and in still somewhat sloppy conditions (lots of amd problems and telescope alarms). At 22h we finally start taking data more consistently. Will make a few hours of polarization data then tomorrow Albrecht will observe the same sources with XPOL for cross calibration.
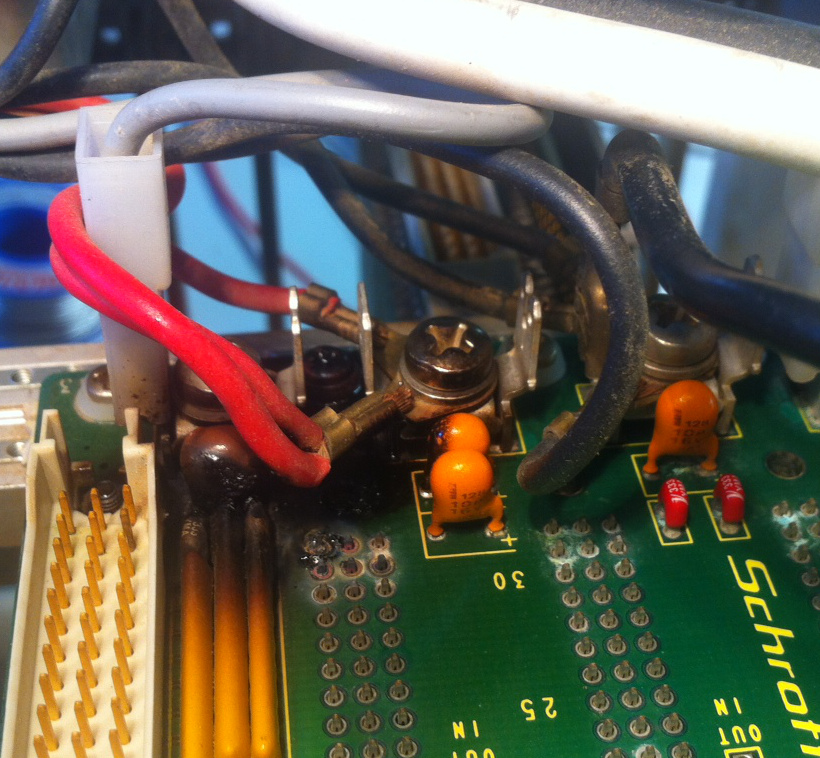
Figure. The source of todays problems..
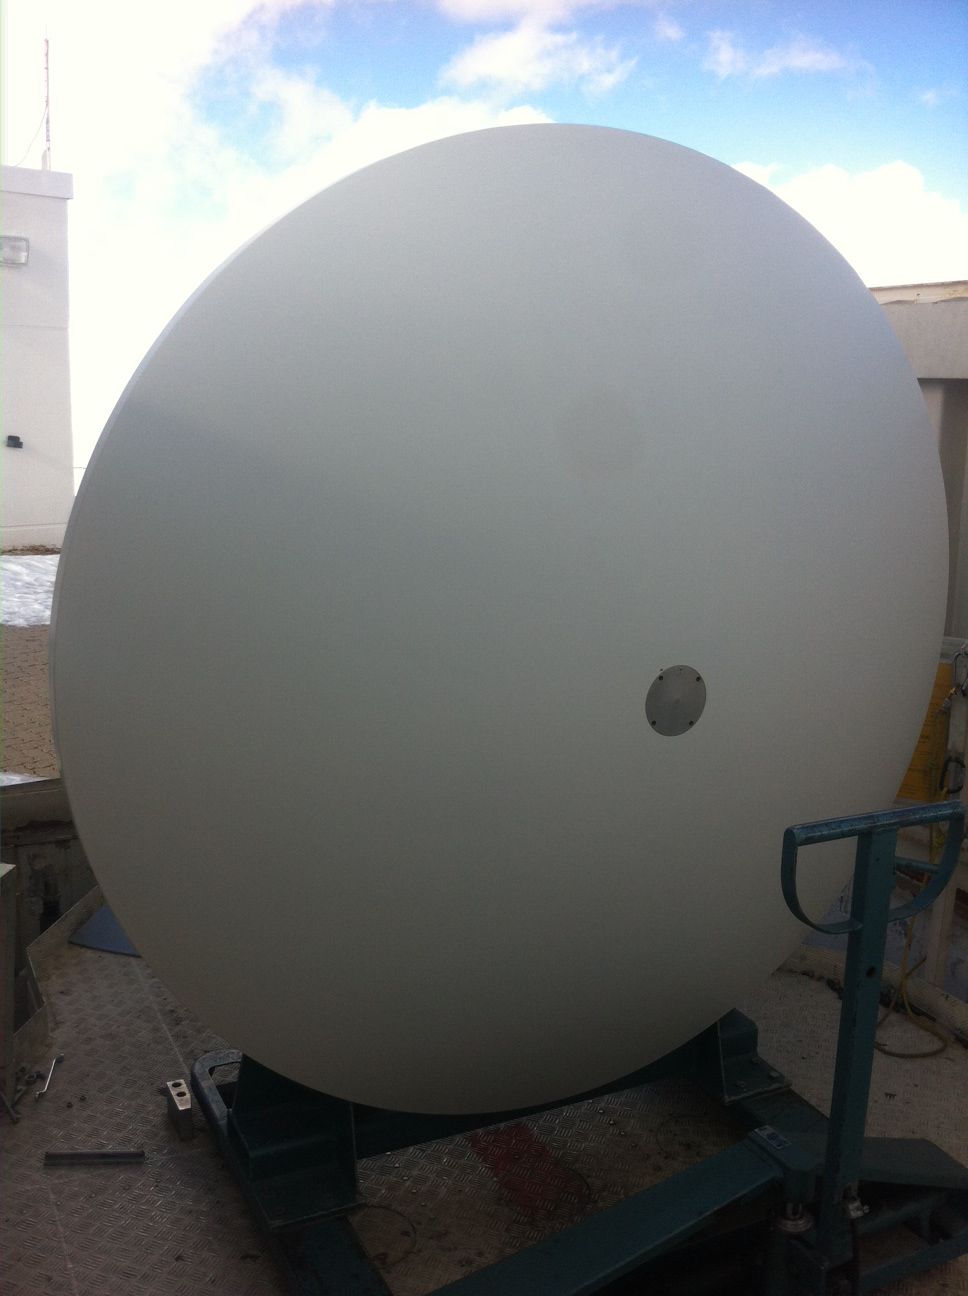

Figure. The M2 mirror at ground level...
January 2016, 25 (Monday)
20h15. Lost connection with M2. Telescope stopped until tomorrow when Juan and Salvador will go up to check. No observations for the night.
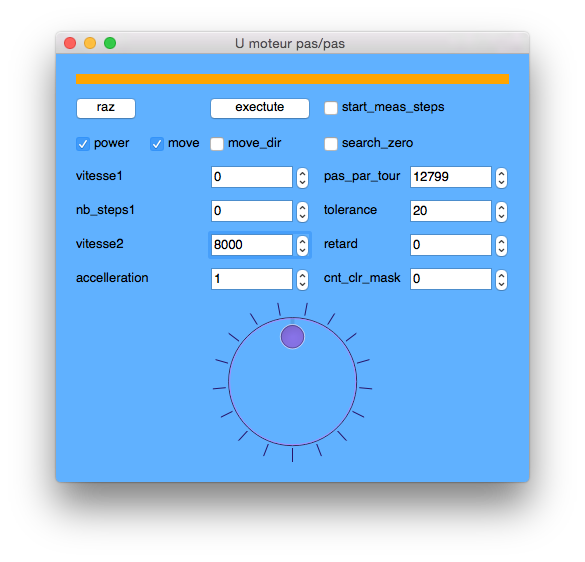
Figure. Polarisation motor parameters.
Polarisation in the afternoon. In "Trace" launch the "U moteur pas-pas". The "RAZ" puts back the default values, so never use it basically. The "EXECUTE" is used to change the parameters while turning but may be better to stop when you want to change the parameters. To start, first fill in the good parameters like in figure, in particular "vitesse2 = 8000", "acceleration = 1", "pas_par_tour = 12799"(the others not important). Then click on "power", then click on "move". The "move_dir" allows to rotate in the other direction should this be needed (e.g. in case one is less vibrating or noisy than the other for any reason). We have changed the 'run15.ini' to add the mppsync (boite U) and div_kid=20 (sampling 48 Hz).
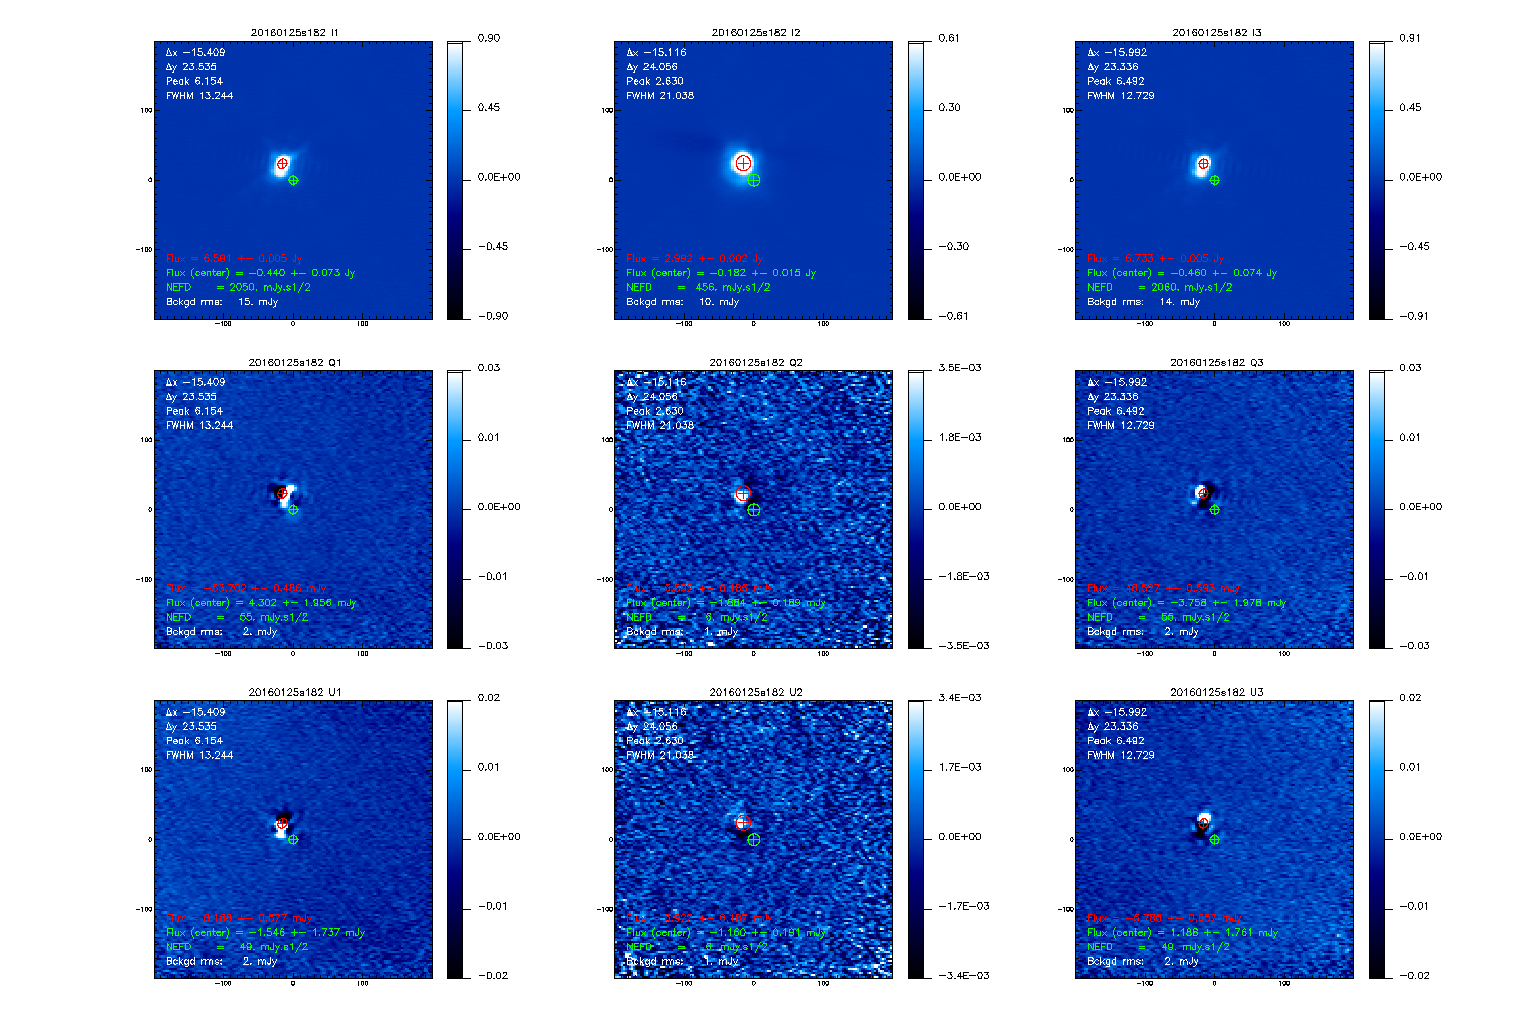
Figure. Polarised OTF map (6x4 arc-min) of Uranus.

Figure. Skydip obtained in polarisation mode (while rotating the half-plate at 2Hz).
Focal plane campaign repeated.
January 2016, 24 (Sunday)
Detection of MM1843 (star forming galaxy at z=4 enshrouded in its dust cocoon). Flux densities from NIKA1 are 33.6 and 6.3 mJy. Weather was poor (Tau_225=0.5). Observed on 23 janv 2016 with 3000 KIDS. Map shown is slightly smoothed.

Continuing the routine. Detected MM18423 (scans 168, 169 and 170, date 23/01) even under poor conditions (tau = 0.5, EL 40 deg) and on individual scans. Remember that this source has been observed by NIKA1 (in very good weather and integrating 83 minutes) with fluxes of 33mJy and 6mJy respectively at 1mm and 2mm.
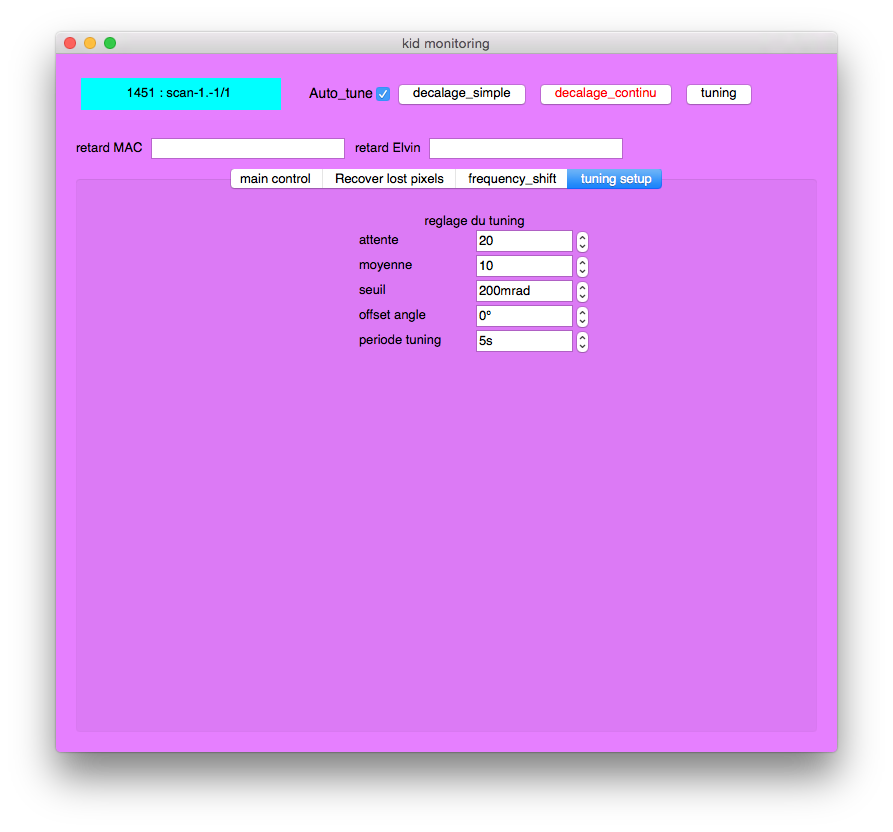
Figure. Tuning setup window with parameters used until now. Fixed in the C code (lecture_elvin.c TBC): trigger for OTF maps 800mrad, trigger for other situations (like telescope slew etc.) 400mrad. Could be these two might be reduced a bit.
January 2016, 23 (Saturday)
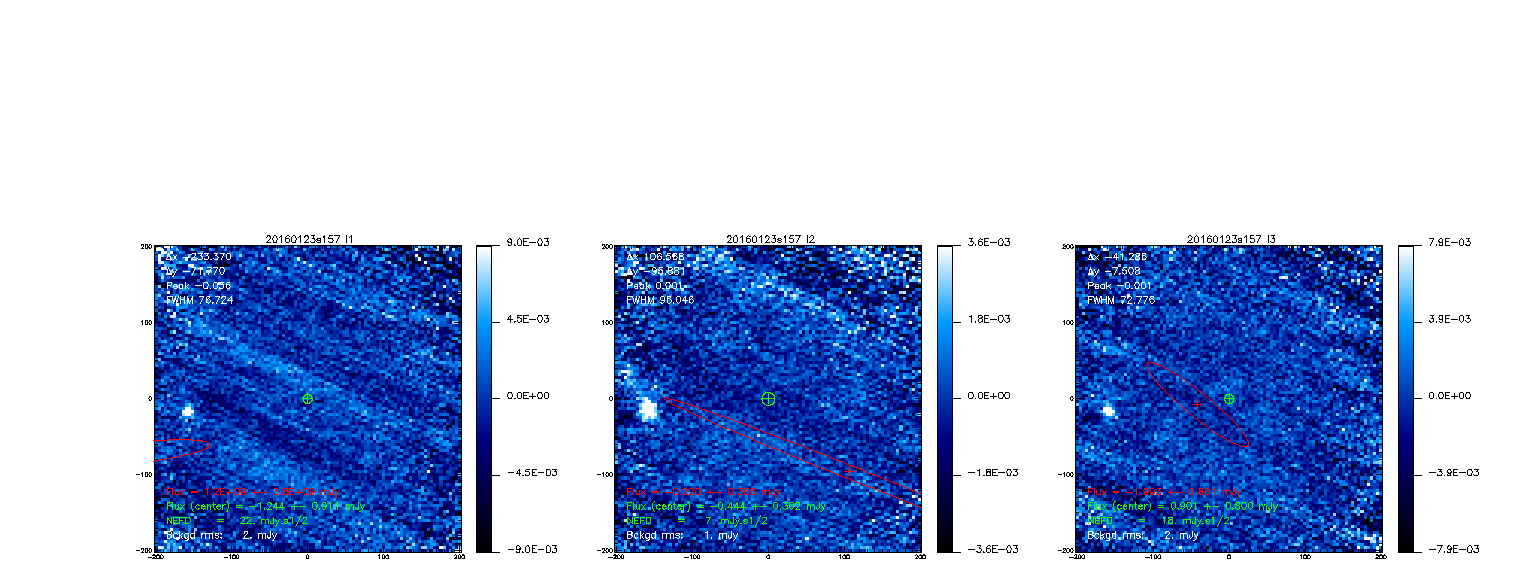
Figure. Pallas mini-planet (500km dia.) detection under poor conditions (tau=0.5 at least at 260GHz, elevation 50 deg) in 15 minutes telescope time. Calculated flux around 120mJy at 1mm, so of the order of 50mJy at 2mm (thermal). The object is offset wrt center, probably the orbital parameters drifted a bit. Total telescope time for this scan around 20 minutes. (T.Mueller et al. give Pallas fluxes for 25-Jan-2016 of 127mJy at 1.3mm and 55mJy at 2.14mm (140GHz) (interpolated between 1.3mm and 3.mm fluxes). Concerning positions, when observing Ceres with EMIR, we also noticed a positional offset relative to the JPL ephemerides (see Table 6 here.) (CK 24-Jan))
1) Characterisation of the arrays :
During the night, we measured the focus variation at the reference KID and at 8 points along the edges of the arrays using nasmyth offsets and focusOTF, and reduced the data with nk_rat on line. The resulting optimum focuses from the flux and FWHM fits have been copied into TAPAS, as well as corresponding nasmyth offsets. They can be easily consulted. A quick look indicates a gradient across array2. Array 1 is more uniform with variations within +/-0.15mm.
The step in focusOTF has been reduced so as to explore 5 focuses between -0.8 and +0.8mm. It was between -1.2 to 1.2mm before. We made a test providing an indication that the precision of a focus measurement is +/-0.05 in these conditions.
Opacity was about 0.5 according to the IRAM taumeter. The sky was clear (stars visible).
2) Secondary flux calibrator monitoring was continued.
3) Beammaps were made.
January 2016, 22 (Friday)
Tuning delays solved by Alain.
We investigated 2 little problems: concatenation of data files when a scan is started before the previous one has finished, and a curious change of behaviour in the rta data reduction maps at mid day. For the 1st one we didn't solve; and need to do a manual pause in scripts running several scans. For the 2nd one we created an option to allow decorrelation with a mask easily.
We continued the beam analysis. In particular we did standard beam maps (tuples of 3 scans to map the full array), and 10x3 arcmin single scan beam map, with 2x2 arcsec resolution to study with accuracy the beam in a significant representative coverage of the image plane. We did it at best central pixel focus and at best overall focus predicted by the simulations.
We started a series of observations on 7 secondary flux calibrators : W3OH, GL490, CRL618, LKHALF101, L1551, MWC349, G34.3. It should be repeated over time and weather conditions.
PAUSE needed between scans (e.g. PAKO focusOTF) to avoid concatenation of data files.
Array3 was lost in late afternoon and resurrected when the telescope moved from Uranus at low elevation to W3OH at high elevation
January 2016, 21 (Thursday)
This morning we have observed until 12am. BTW we could easily detect a bright and weakly extended source at 1mm with tau = 0.9. Then telescope stopped all day, we start again at 19h. Test with cross, Lissajous, the tunings are OK.
Arrival of Samuel and Juan. Latter on departure of Nicolas P.
Afternoon and night observations plan: focus on beam maps and small maps at various positions on the image plane to study the beams problem. But doing scans we found out a number of problems to solve first: delays of tuning w.r.t. subscan start and stop; concatenation of data files when scans are launched in a raw without pause between them. Alain and Alessandro have been working on the delays. Nico has implemented in the IDL online processing a tuning and delay monitoring feature among other monitoring plots. This tuning and delay plots show the az and el vs time, with the FPGA change frequency (=tuning), and time delays of the ELVIN messages.
January 2016, 20 (Wednesday)
The telescepe has been stopped all day due to fog. We've worked to recover results from yesterday's session and adapted new pako scripts for our next try. We have looked more into the details of the delays between the telescope and NIKA2 as far as messages are concerned.
It's now 11.45pm, there still is ice on the secondary so we cannot observe, but we can move the telescope to check the messages and test the corrections coded today on the acquisition.
We've retested all our sequences and they seem fine. Althought there still is ice on the secondary that prevents us from a nice beam and focus characterization, we try to do the mini pointing session to have improved preliminary Nasmyth offsets from Juan Penalver. It's windy outside but snow should not come so soon.
January 2016, 19 (Tuesday)
Maintenance day; change of team with the arrival of Jean-Francois and Laurence.
The observations started at 5 p.m (local time) and ended at 2 a.m. the next day.
The main objective was the characterization of the focus dispersion in fonction of the kid position in the focal plane. We planned a sequence of observation based on focus scans of the same source (e. g. Uranus) at a series of offsets chosen to probe various locations of the focal plane. The offsets lie along 4 diameters accross the focal plane separated by an angle of around 45° (star-shaped probing).
We begin the sequence in using nkfocussliss z for the focus measurement. It consists of one scan divided in 5 subscans at different value of the focus z. Nico P. adapted the pipeline to account for a decentered source (i.e. source away from the map center). In every two subscans, the source was back to the center. Nico B. reported a known bug affecting the lissajous scans: the offset information is not correctly transmitted every two subscans.
We went on to using the focusslissold pako script (reminder: it is a series of 5 scans at different focus z value). The pipeline modification for accounting the offset was propagated to nk_focus_old. More than half of the scans in a 5-series were not usable for the focus fit due to various reasons:
- too noisy
- pointing issue without the usual flag (not properly accounted for by the pipeline)
- jump in the data
- and so on.
During the whole observation period (which stopped at 2 a.m. due to bad weather), we experienced an acquisition/resonance problem at least every 30 min...Most of the acquisition issue were related to a synchronisation issue. The problem was reported by Alessandro and is currently discussed by Oliver and Alain.
January 2016, 18 (Monday)
14 - 18h. Nice observations. See the beam-maps on the "offline processing" page. I had time to check the response on the time traces. The potential sensitivity is very good also at 1mm. This was checked on Neptune and Uranus and confirmed on the "offline processing" plots despite the rough calibration.
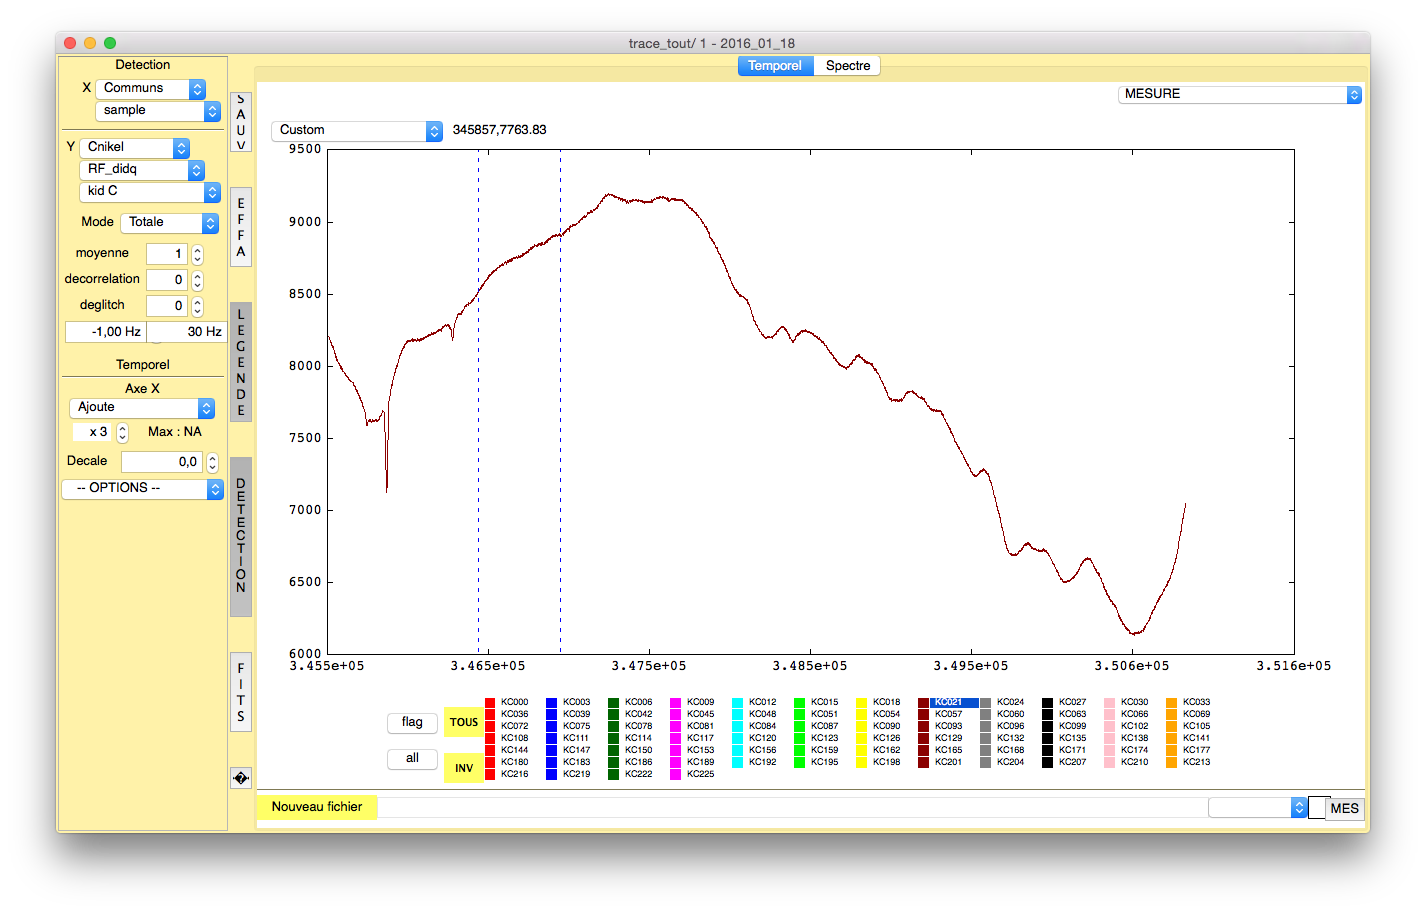
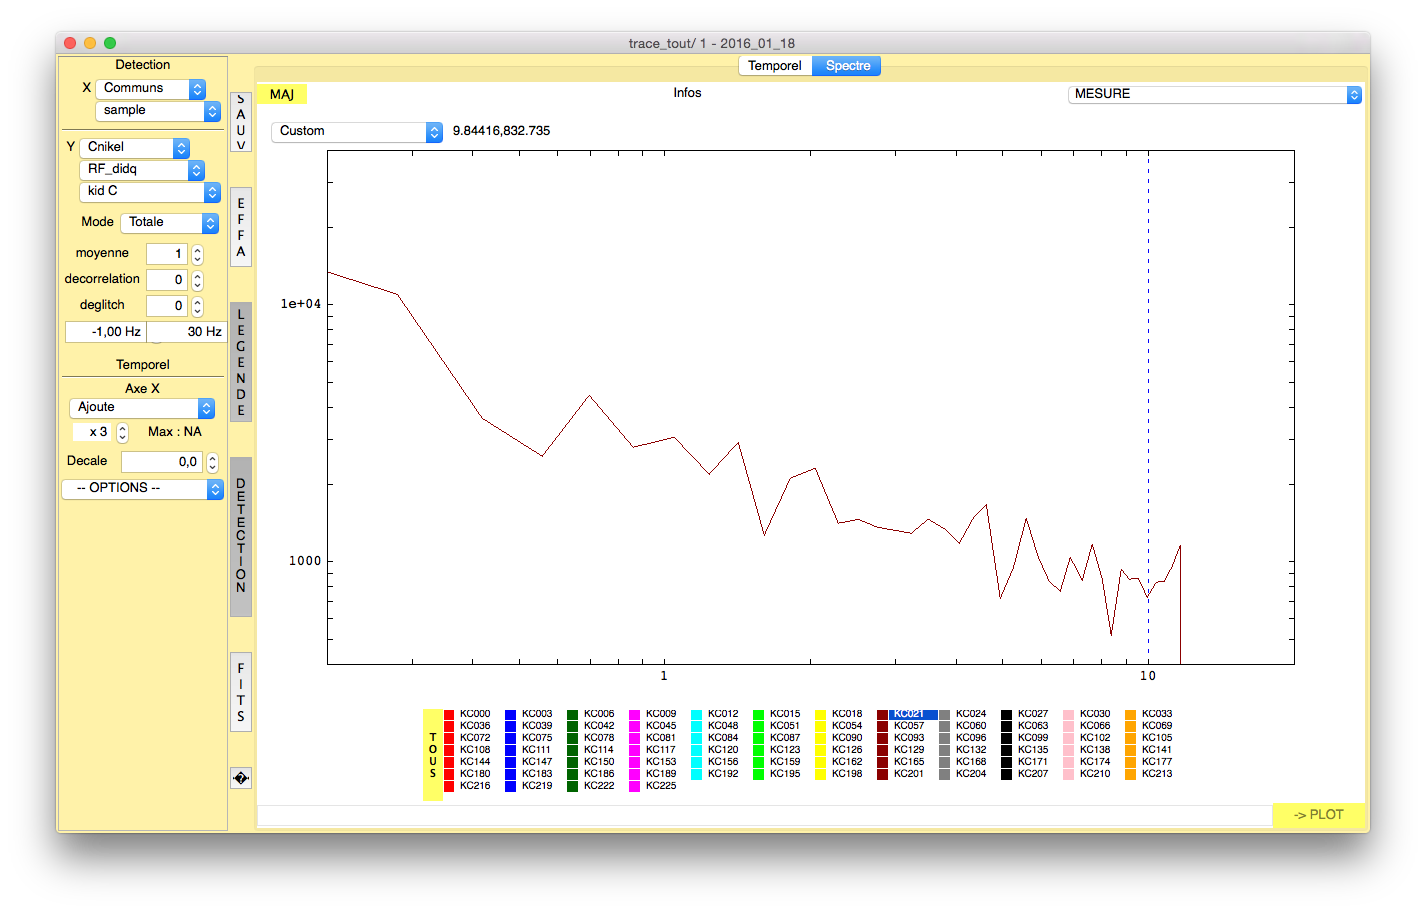
Figure. 2mm array, a good pixel crossing Neptune (7 Jy at 150GHz). Signal is 600Hz, while noise is 0.8Hz/sqrt(Hz) for a S/N of 750. Means a theoretical sensitivity on this pixel of 9mJy/sqrt(Hz). On the same 2mm array, for a not particularly good pixel crossing Uranus (18 Jy): signal is 1650Hz, while noise is 1.6Hz/sqrt(Hz) for a S/N of 1000. Means a theoretical sensitivity on this pixel of 18mJy/sqrt(Hz).
For these observations the tau was very low (0.1-0.2), so at 150GHz the transparecy correction is negligeable for elevations of 45-50 deg. The "really good" pixels (how many of them ? Say 50-70%) should lie in between these two values for this array.
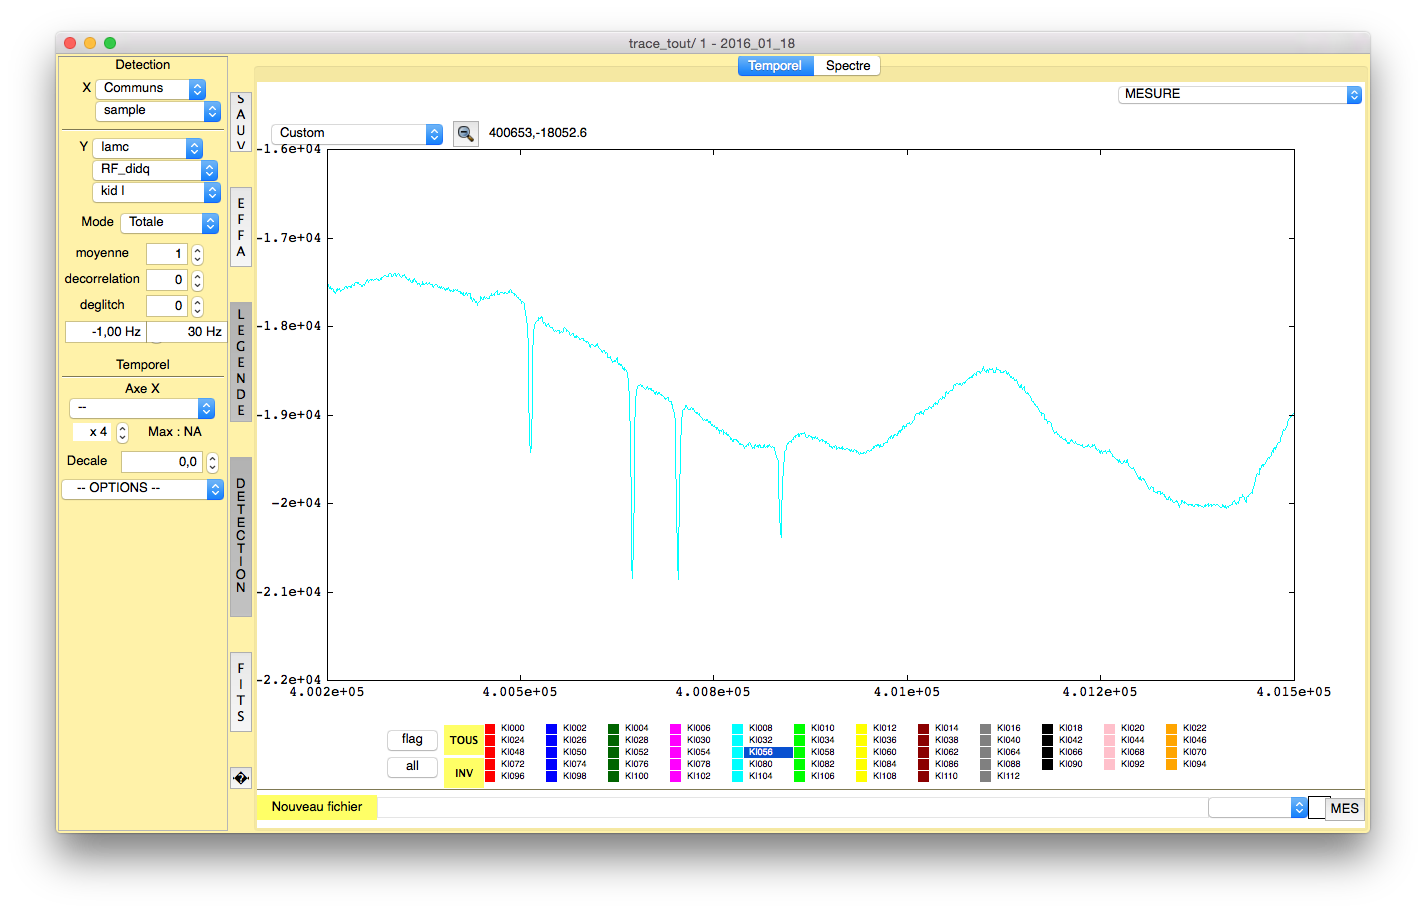
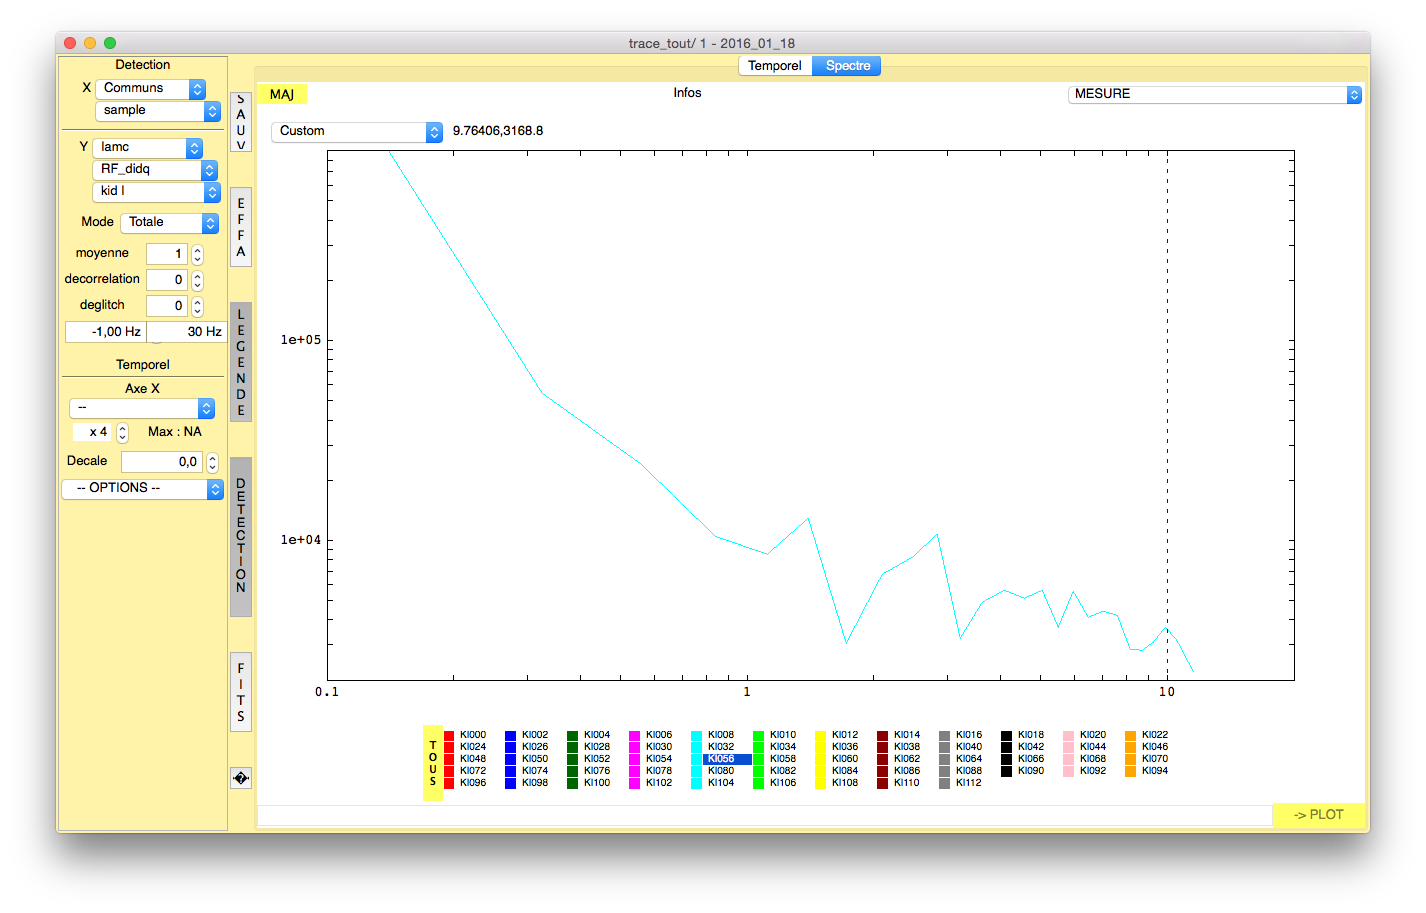
Figure. 1mm array H (RF electronics, array 1). A good pixel (but many show these performance) crossing Neptune (17 Jy at 260GHz). Signal is 2200Hz, while noise is 3Hz/sqrt(Hz) for a S/N of 733. Means a theoretical sensitivity on this pixel of 23 mJy/sqrt(Hz) per pixel receiving only half of the power.
The tau was very low (0.1-0.2), but at elevation around 45 deg and at 260GHz the transparecy correction is may be small but not entirely negligeable. 10-20%, so the sensitivity is even better. Should also consider the fact that we still have some problems on the beams. In conclusion, I think that the 1mm arrays that are installed have the potential to achieve the goal sensitivity under very good observing conditions. They behave in any case quite well also under average (tau 0.4-0.5) observing conditions. This is a big improvement compared to NIKA1 for the 1mm band.
January 2016, 17 (Sunday)
10h. Changed the run15.ini to add more power on the array 3 (niv = 3 on both now). Power around -50dBm per tone on the 1mm before the 10m cables. Say -52dBm at cryostat input. May be we could increase further to niv=4. I'll try tomorrow.
Observed 14-18h under tau=0.3-0.4 conditions. Worked well. Made a good beammap, focus, pointings etc. Changed power on array 3 that now seems better, comparable to array 1. Yesterday made a nice beammap too showing 88% good pixels on array 1, 79% on array 3 and 65% (only) on array 2. I think these are reasonable numbers. May be on array 2 we could arrive at 70%. See "offline processing" for more details. I haven't seen jumps on the 1mm arrays, not even while slewing the telescope. On 2mm I confirm big jumps during slews (harmless). I haven't seen jumps during the scans but the sky noise might hide small (100Hz and smaller) ones.
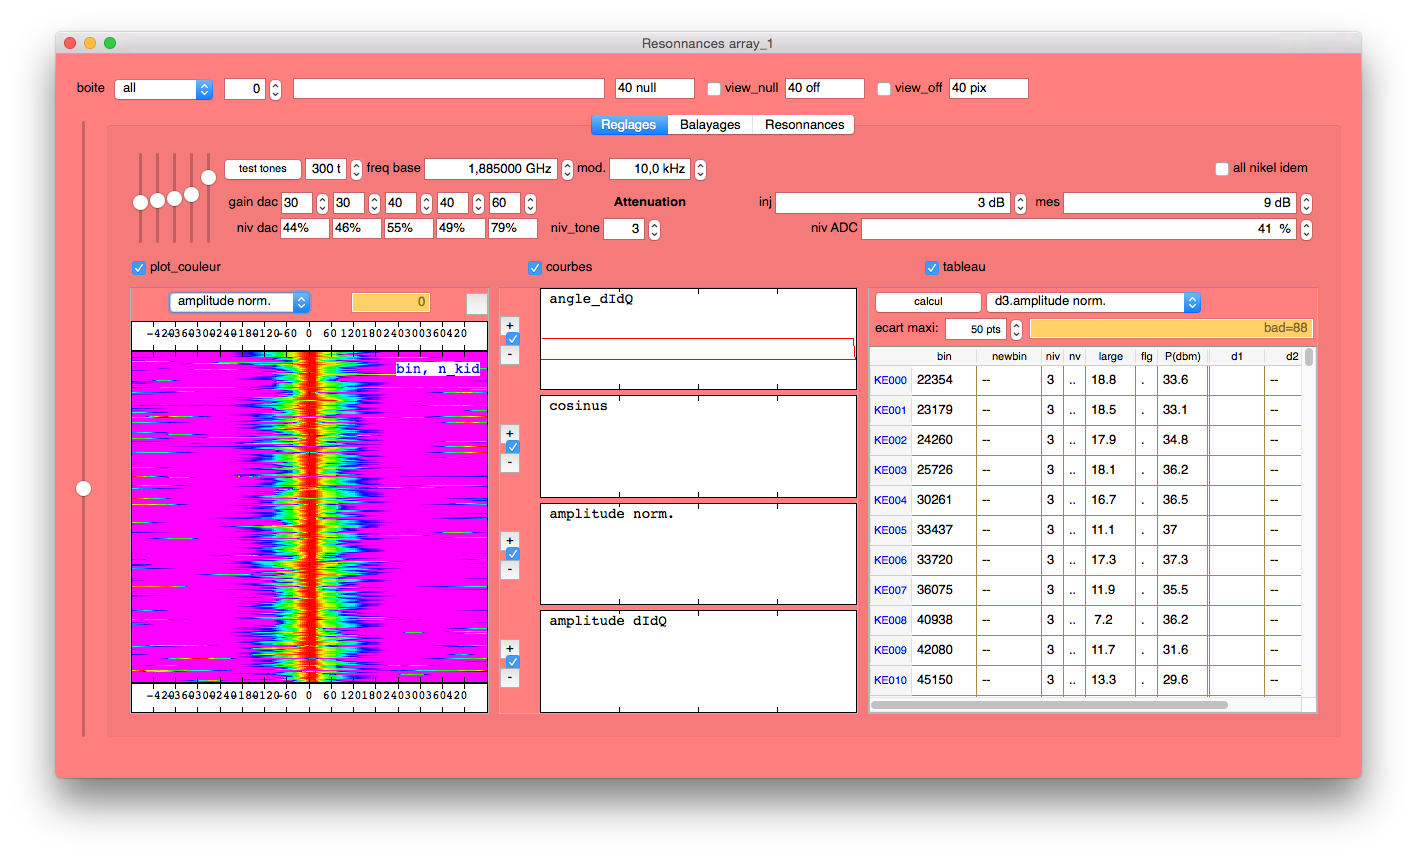
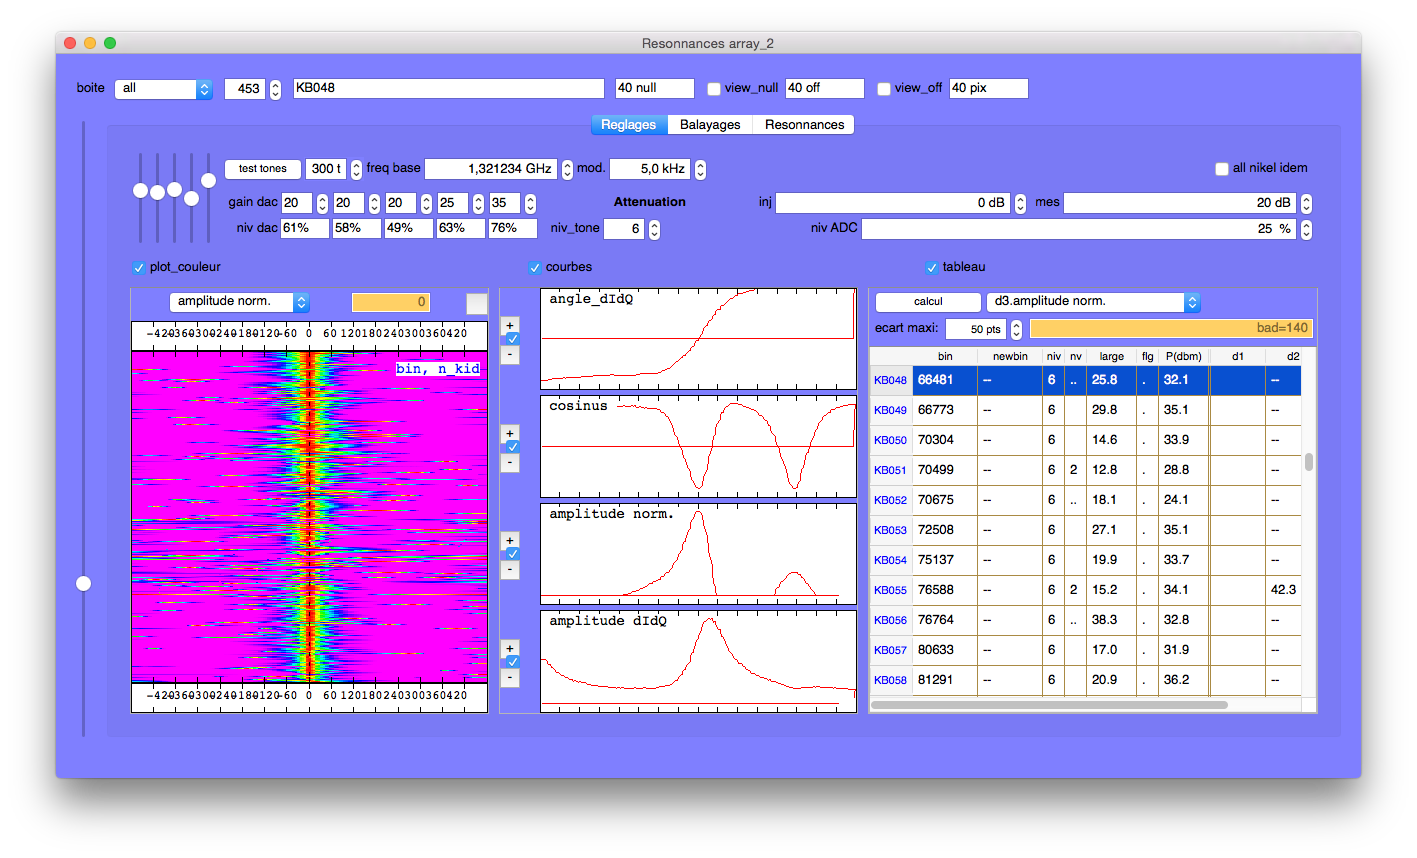
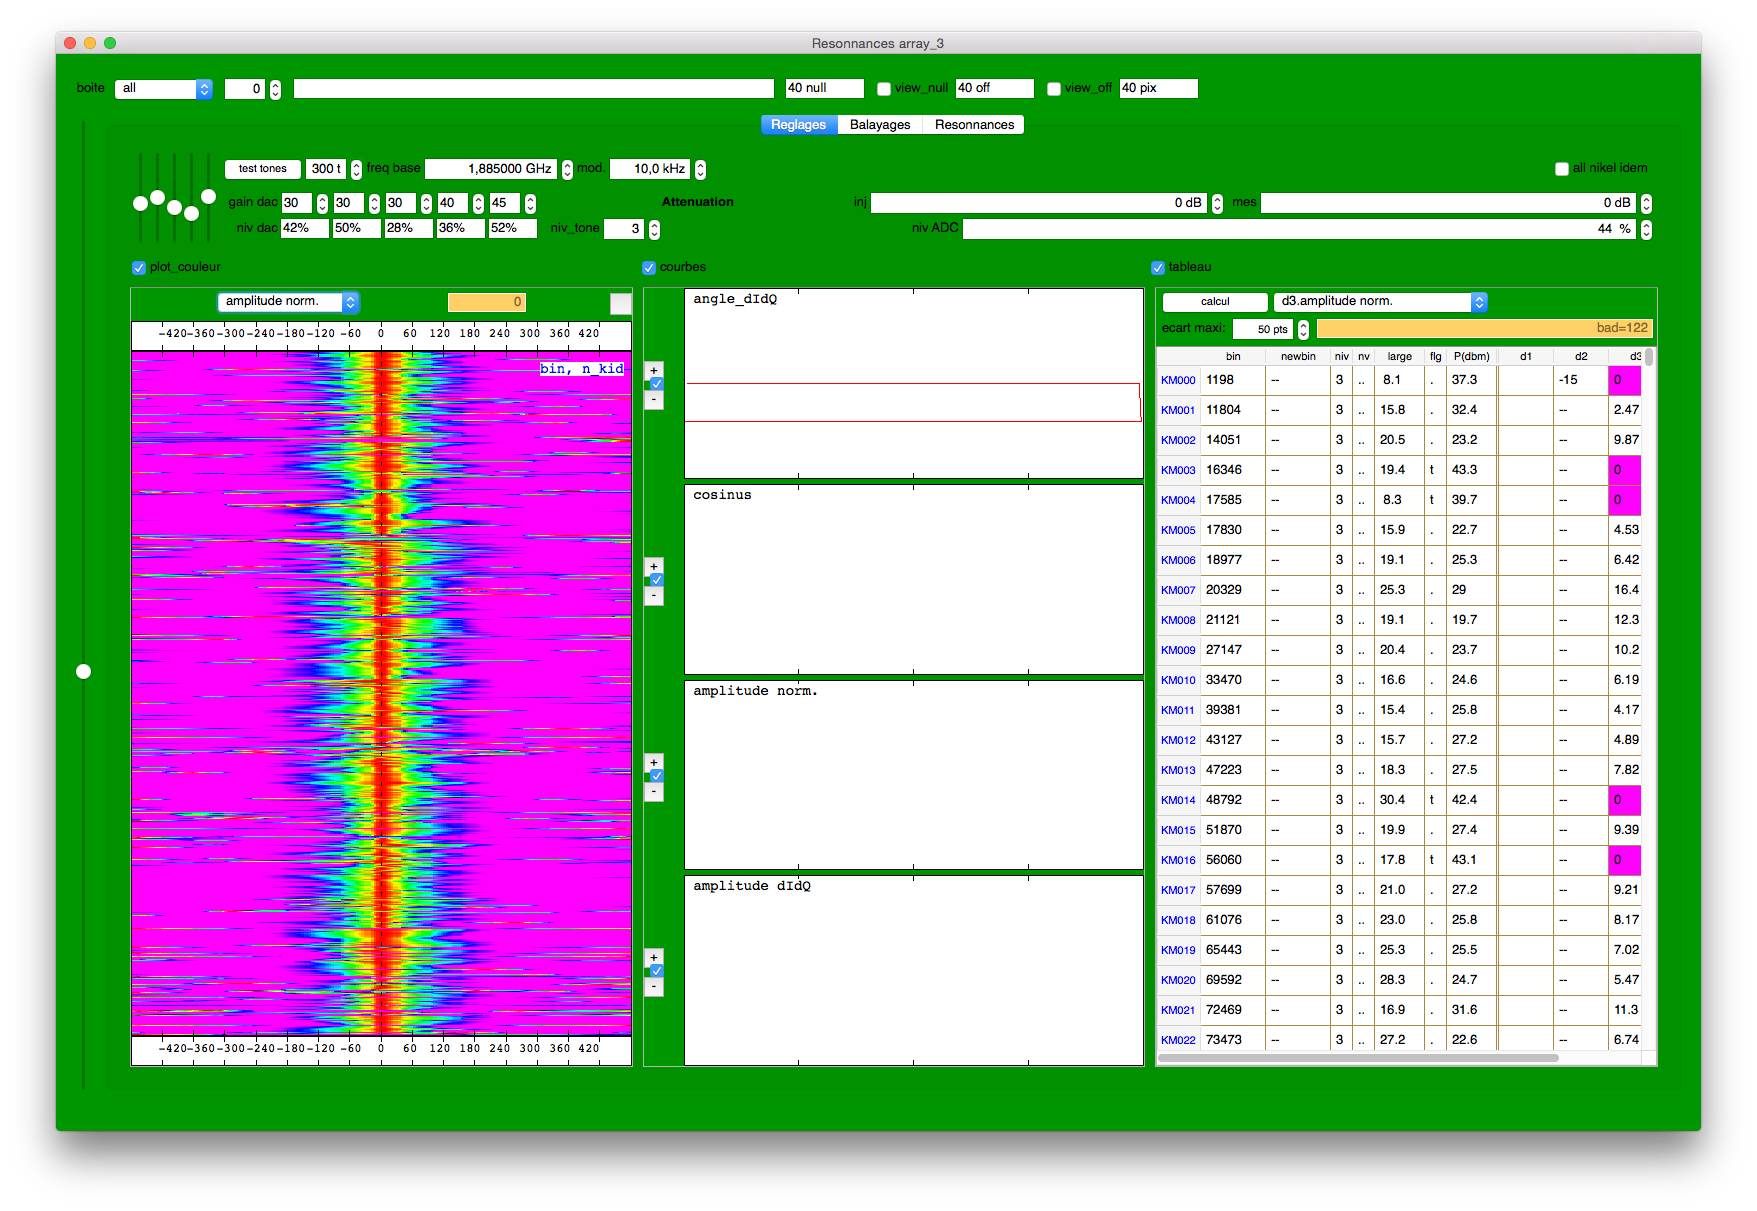
Figure. Final parameters for arrays 1, 2 and 3 respectively (from left to right).
January 2016, 16 (Saturday)
Clear sky, wonderful views. We start observing at 15h and until 19h.
Noticed interesting things while slewing the telescope.
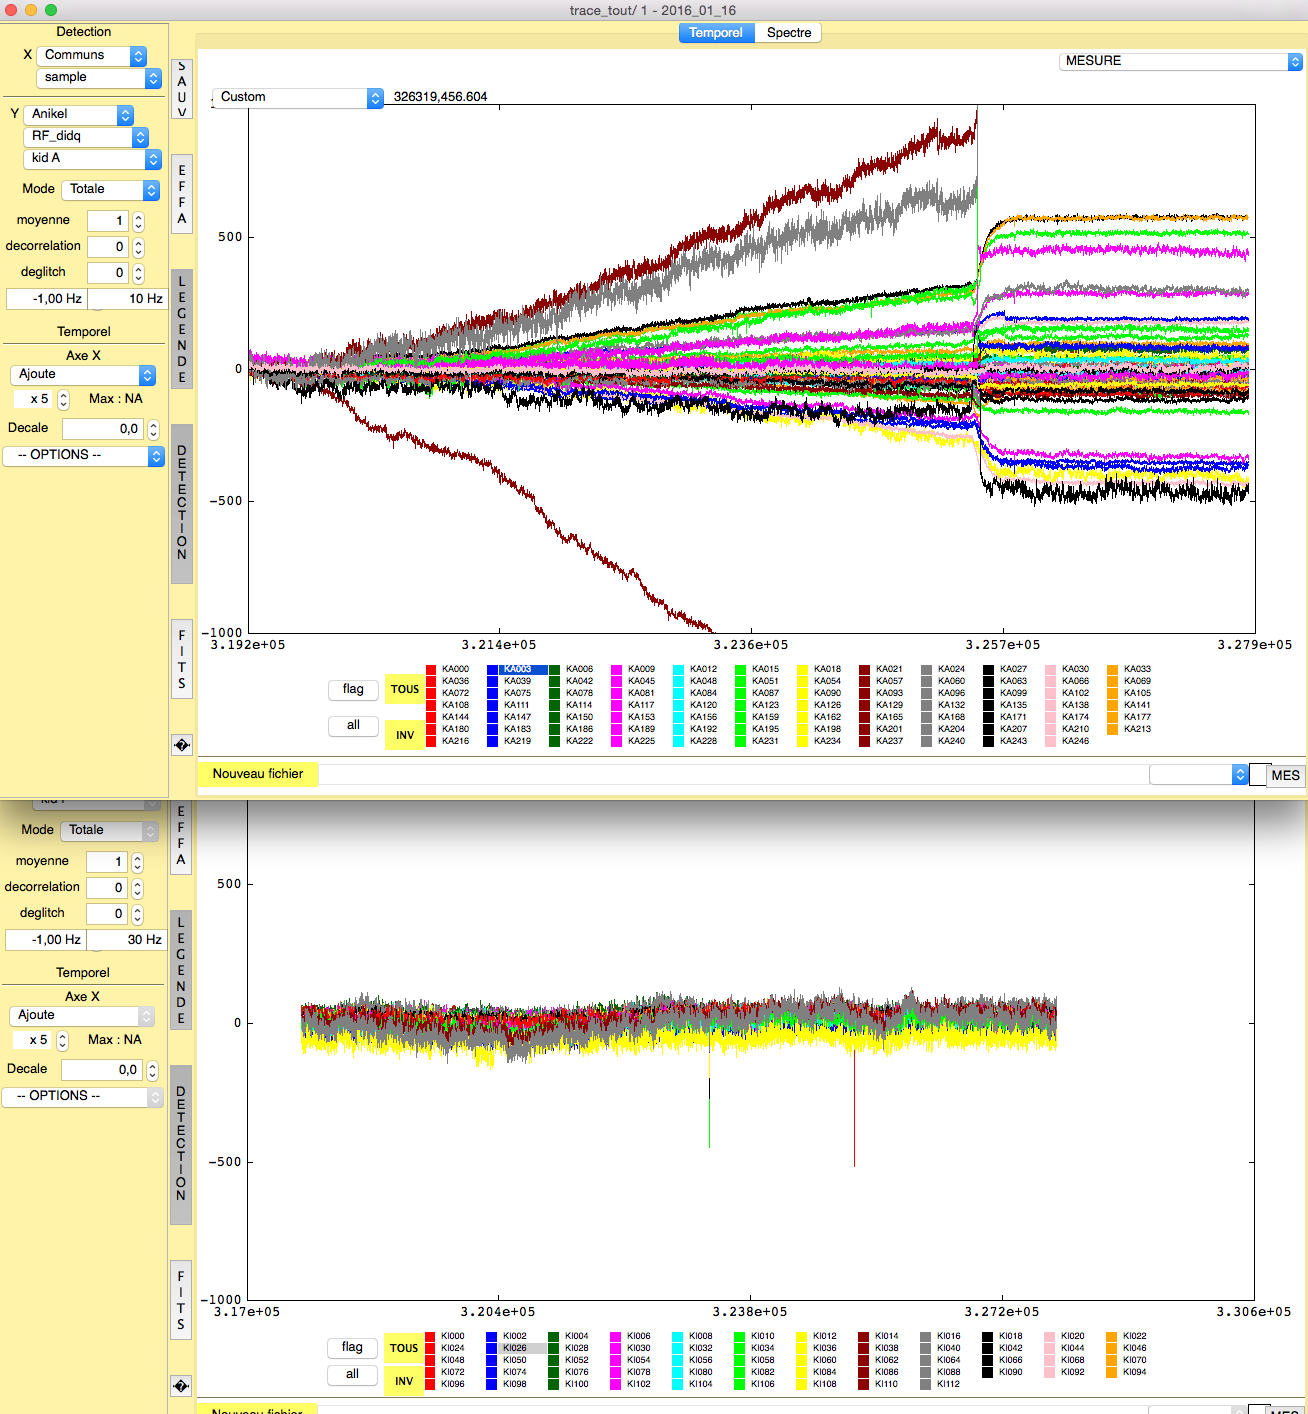
Figure. Telescope slew as seen by the 2mm array (top) and 1mm (bottom). Clearly the 1mm arrays are less sensitive to this effect.
See 'offline processing' for some beam-maps showing the footprint of the arrays !
January 2016, 15 (Friday)
The telescope was down the whole day because of the weather.
January 2016, 14 (Thursday)
01h00. Changed run15.ini (for svn revision < 10032 run15.ini without offs). For > 10032 with off-resonances on arrays 1 and 3.
January 2016, 14 (Thursday)
01h30. We go to the sky. Telescope staring at EL = 43 deg under tau = 0.2-0.25 and good conditions in stability.
We first measured the shift between the window and the sky (say 50K), then we have measured the shift between the window and the 300K of the cabin (say 300K UPPER limit). The box B is measuring strangely. But on the others we conclude that:
2mm: 400kHz shift for 300K so 1.3kHz/K
1mmV (NIKEL DC): 650kHz for 300K so roughly 2.2kHz/K
1mmH (NIKEL RF): 800KHz for 300K so 2.7kHz/K
See the noise and comments below for S/N and mK/sqrt(Hz) sensitivity.
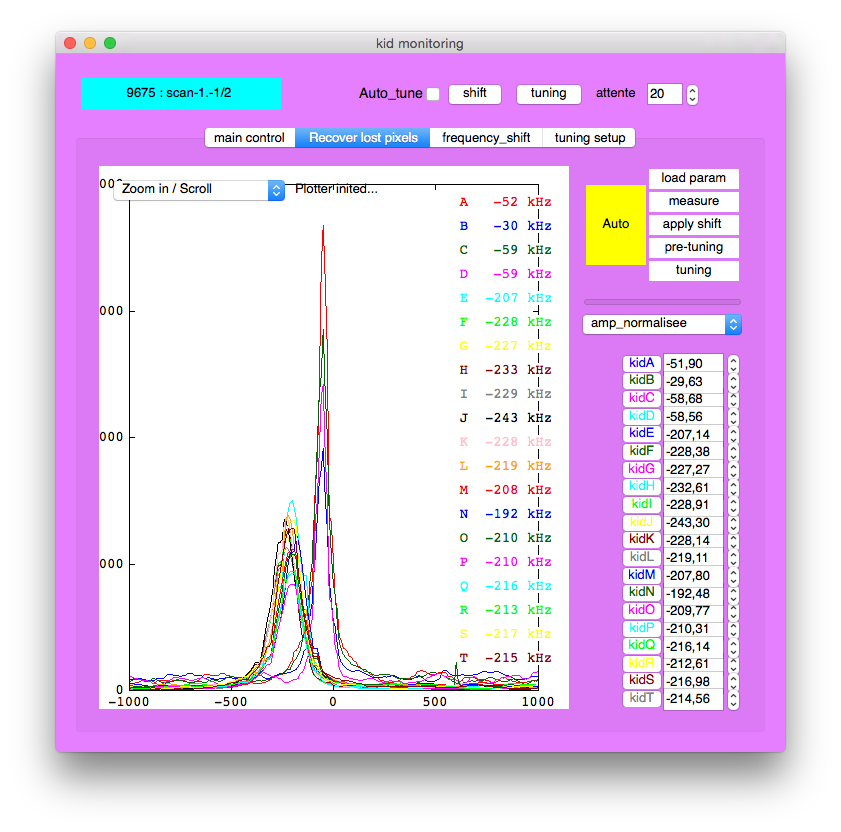
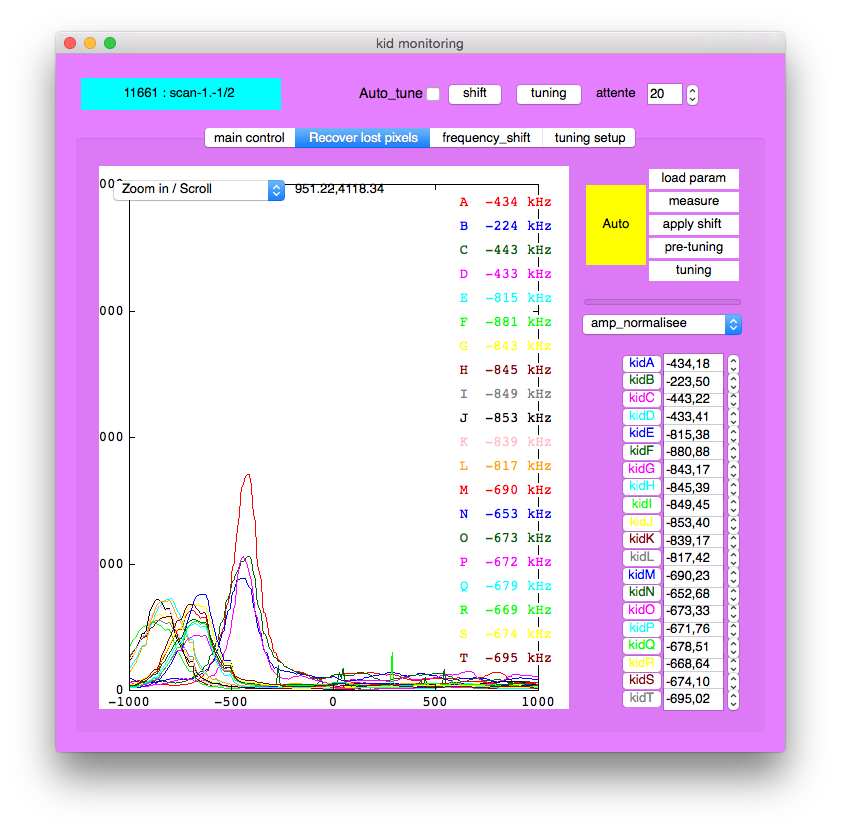
Figure. Left: shifts between window (0K) and Sky tau 0.2, elevation 43 deg (say 50K ?). Right: shifts between window (0K) and 300K of the cabin.
The noise on the sky seems OK (say great) on the arrays 1 (1mm NIKEL RF) and 2 (2mm). Worse on array 3 (1mm NIKEL DC).
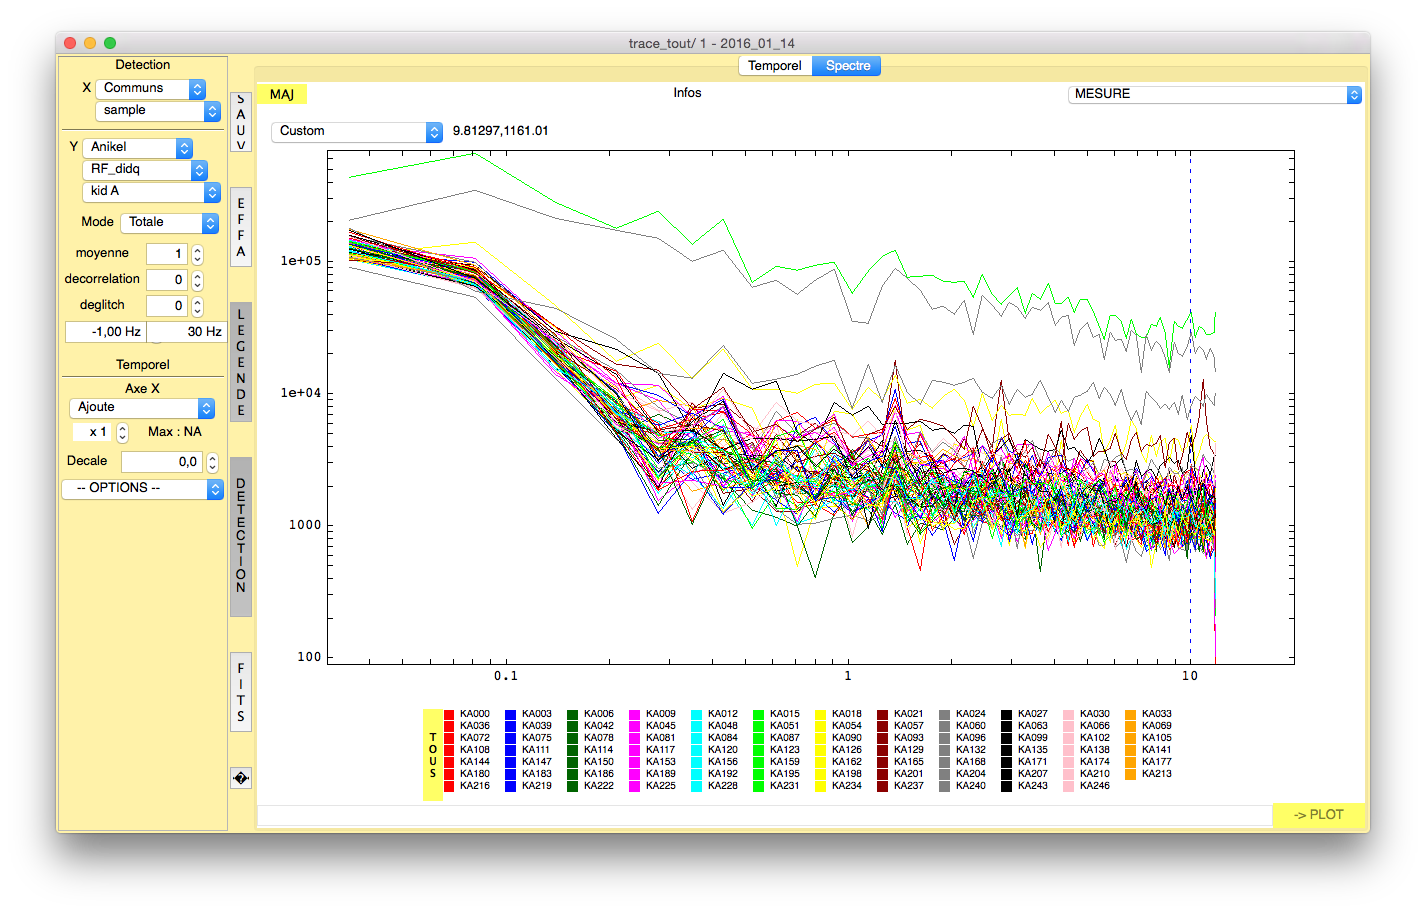
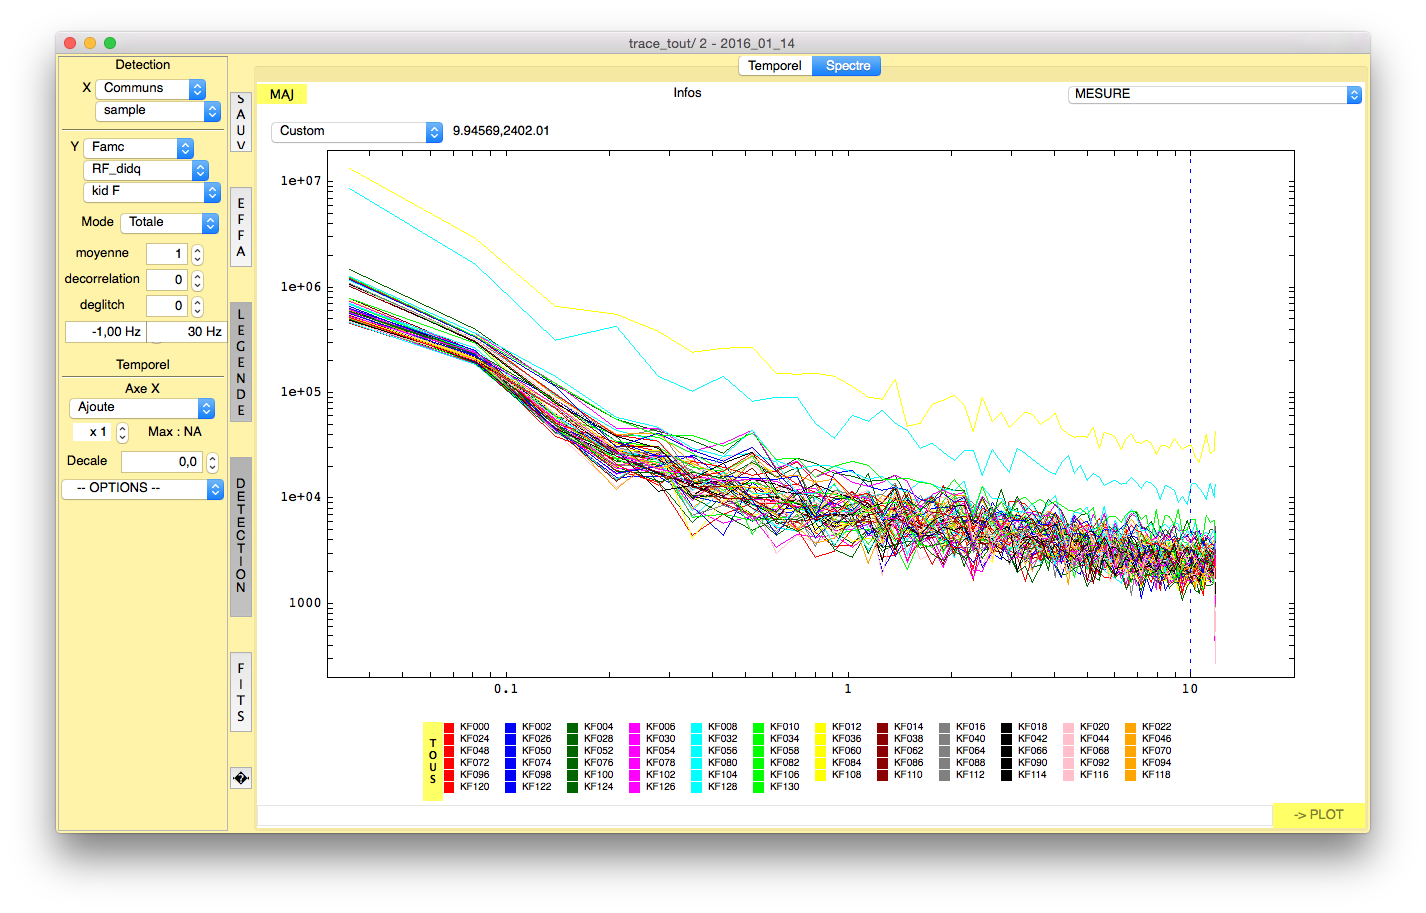
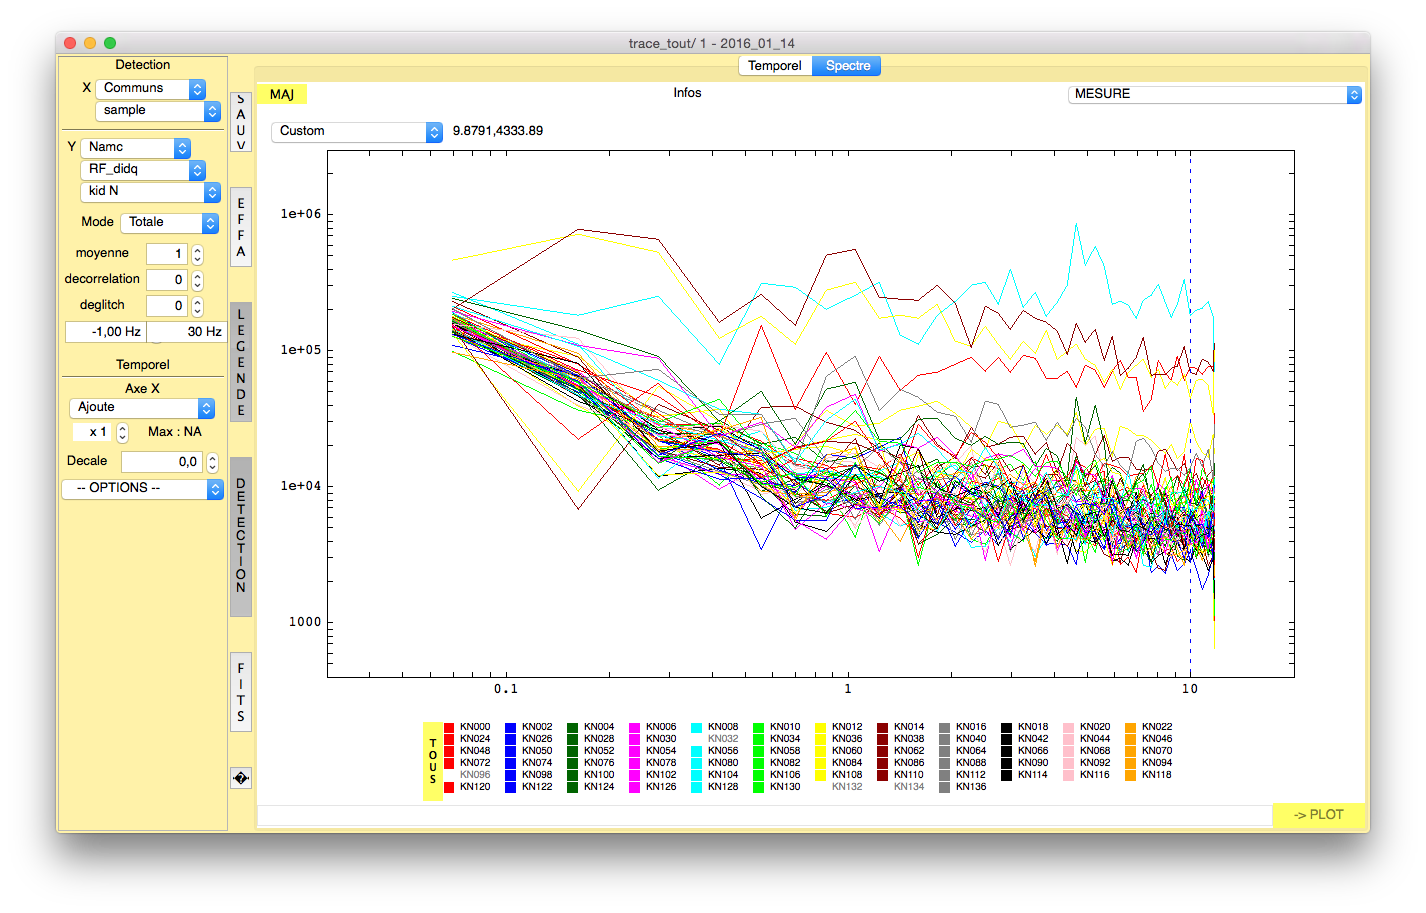
Figure. Noise on the sky on respectively the 2mm, 1mm NIKEL_RF (array 1) and 1mm NIKEL_DC (array 3).
ROUGH T SENSITIVITY CALCULATION:
Say the noise is 2Hz/sqrt(Hz), 1.3Hz/sqrt(Hz) and 3Hz/sqrt(Hz) for the three arrays respectively. The sensitivities are thus:
2mm: (1.3/1300) K/sqrt(Hz) = 1 mK/sqrt(Hz) per pixel
1mmV (DC): (3/2200) K/sqrt(Hz) = 1.4 mK/sqrt(Hz) per pixel
1mmH (RF): (2/2700) K/sqrt(Hz) = 0.75 mK/sqrt(Hz) per pixel (!!!)
So the response is good, as calculated in laboratory, as well as the noise at the end. Still to check if these photons to whose we are so sensitive are correctly focalised.
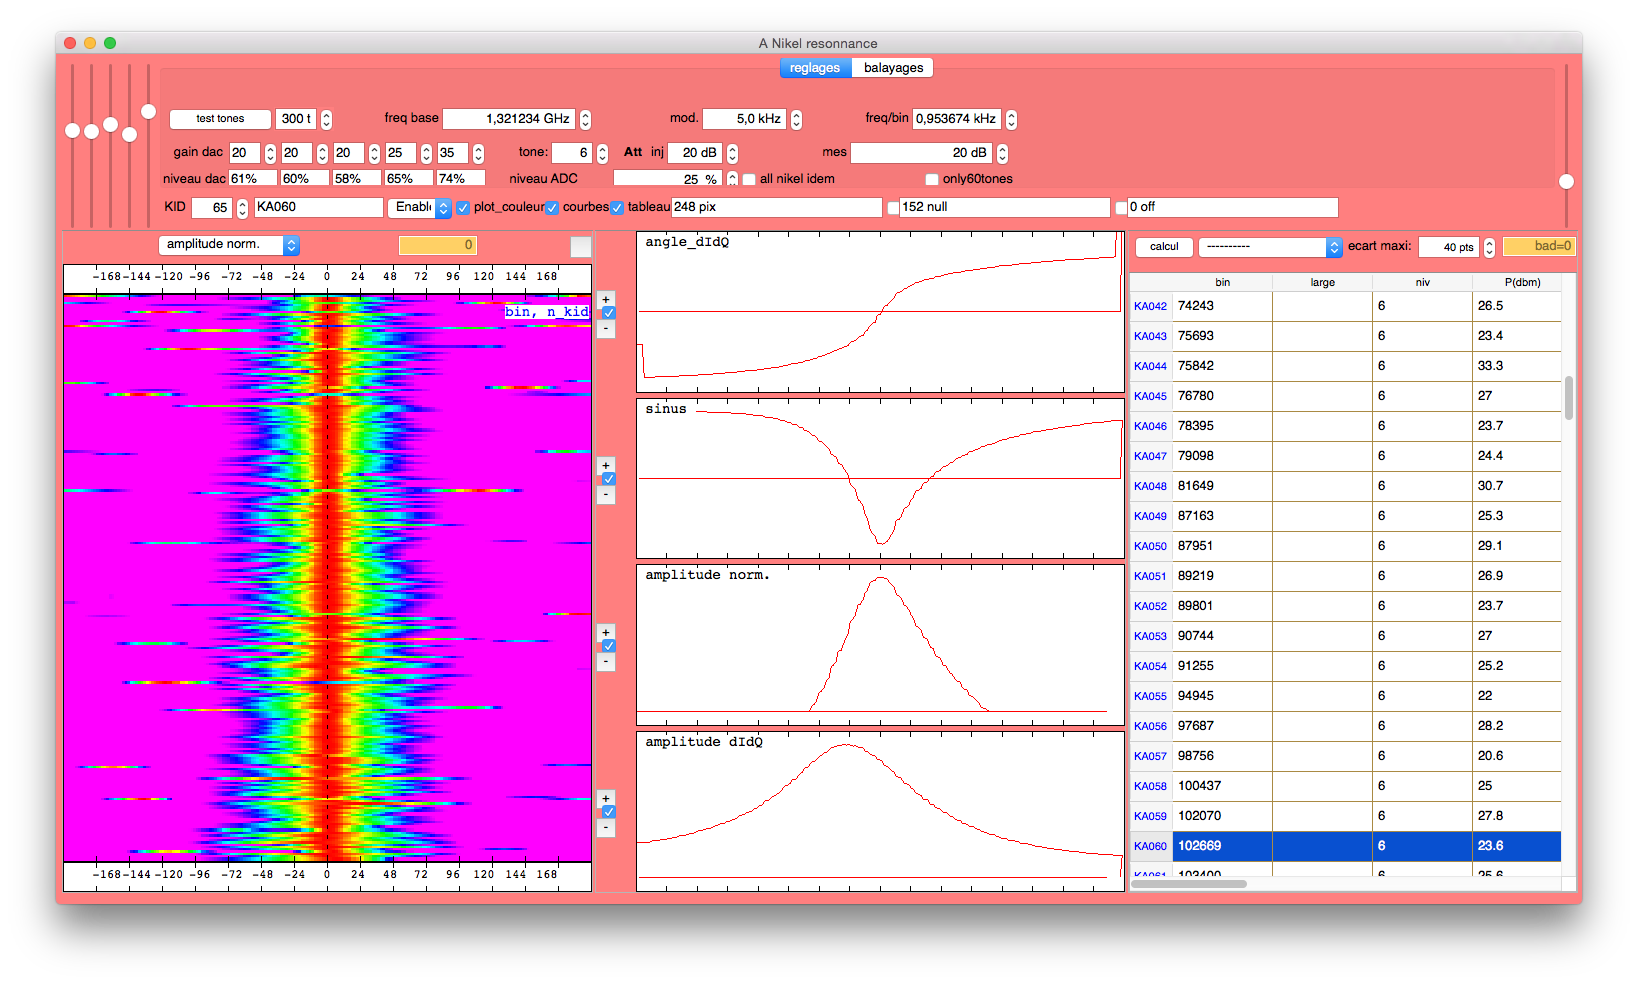
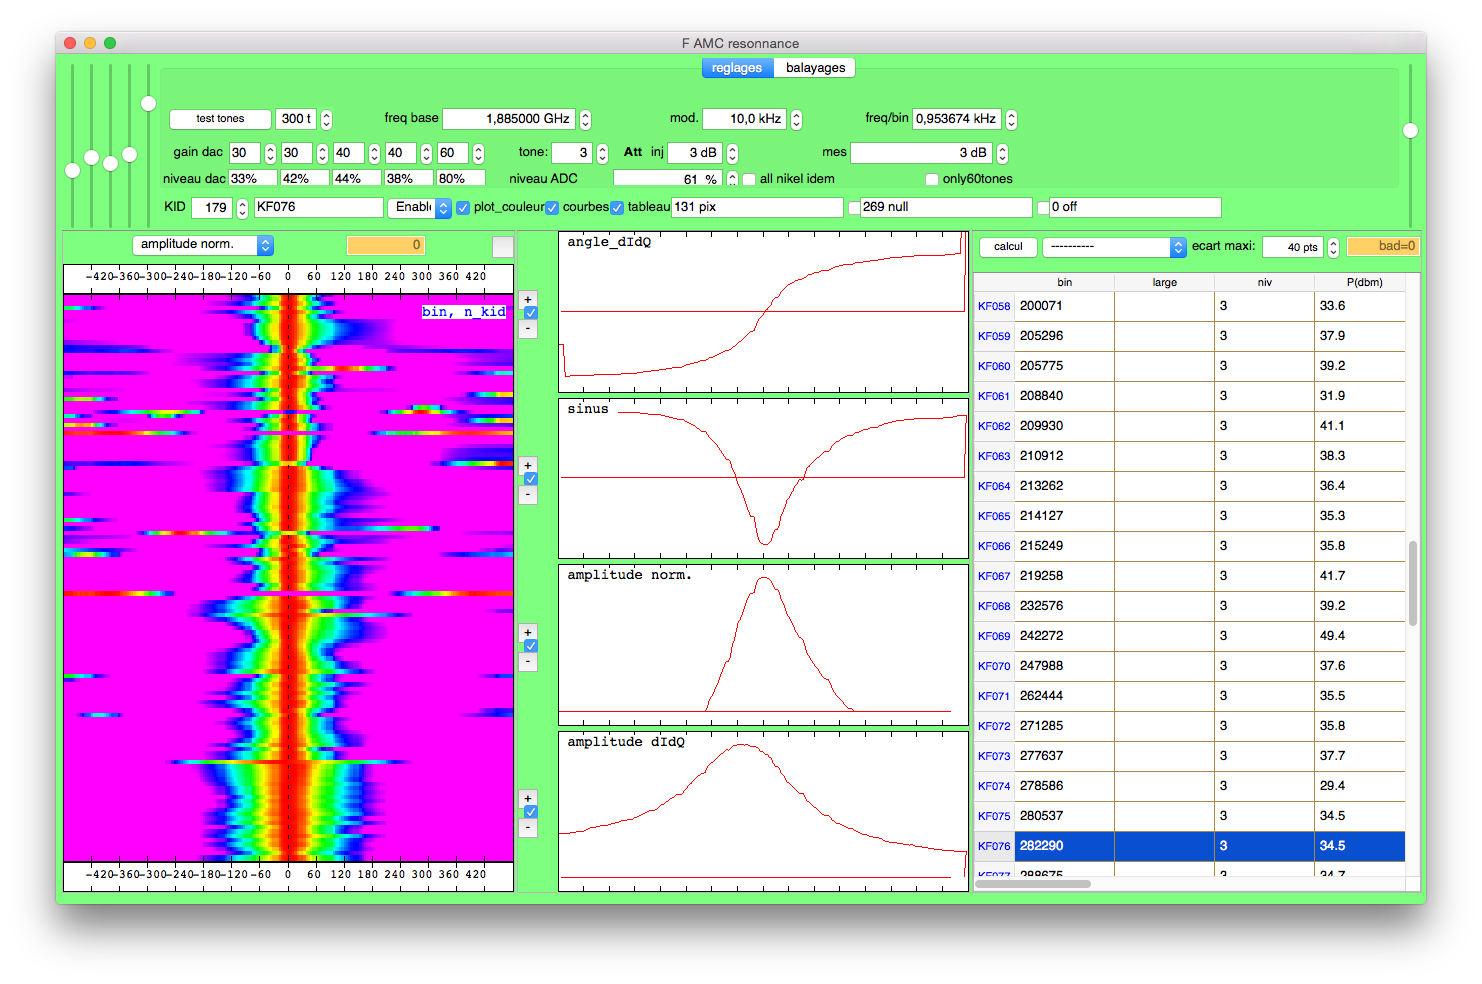
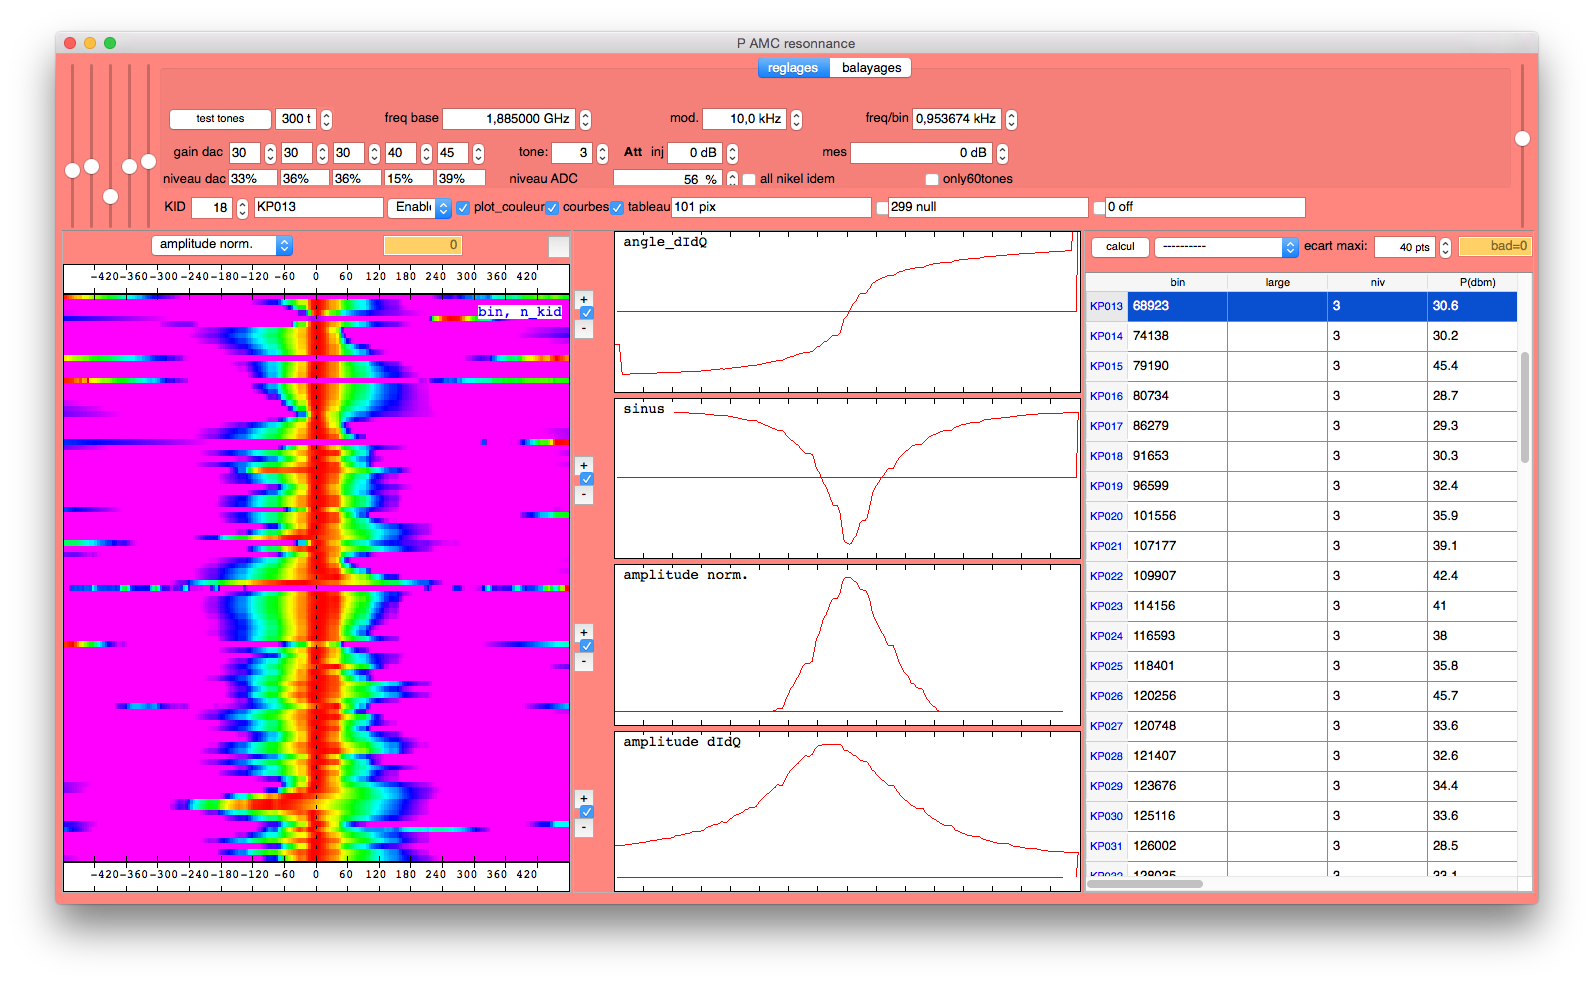
Figure. Parameters and sample frequency scans of, from left to right: 2mm (box A), 1mmH (box F) and 1mmV (box P).
14h. The observations start. Beammaps with FOCUS = 0mm on Uranus rising from 20 to 60 deg.
SEE 'offline processing' for some results.
January 2016, 13 (Wednesday)
19h30. NIKA2 HAS ALL THE 20 LINES CONNECTED AND ALL WITH RESONANCES. WE ENTERED THE 3000 PIXELS ERA.
THE NOISE (with the window) seems OK. On three random lines over the three arrays I see on average 1Hz/sqrt(Hz) (2mm), 2Hz/sqrt(Hz) (1mm, NIKEL_RF) and 2.5Hz/sqrt(Hz) (1mm, NIKEL_DC). Very flat on the 2mm one, a bit less on the 1mm ones. Still no traces of the pulse tube. I think that the difference between the noise on the NIKEL_Rf and the NIKEL_DC can be explained with the modulation. The nominal 10kHz modulation on the NIKEL_RF are in reality 6.5kHz, while on the other RF source attached to the NIKEL_DC we have 9.5kHz. Or viceversa. So the RF_dIdQ is calculated a bit differently. So my conclusion is that most probably there is no real difference between the two configurations.
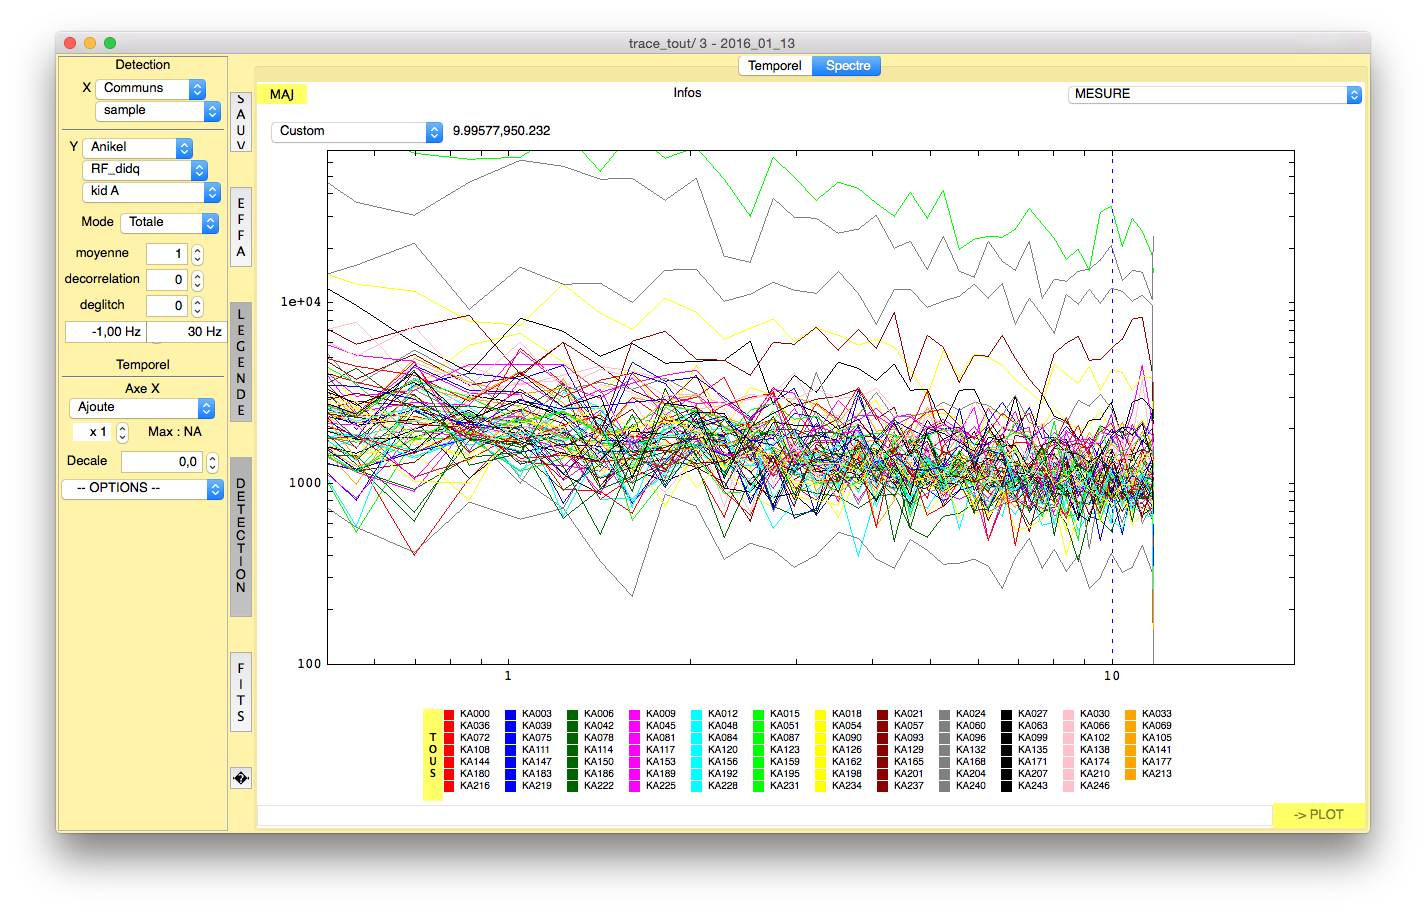
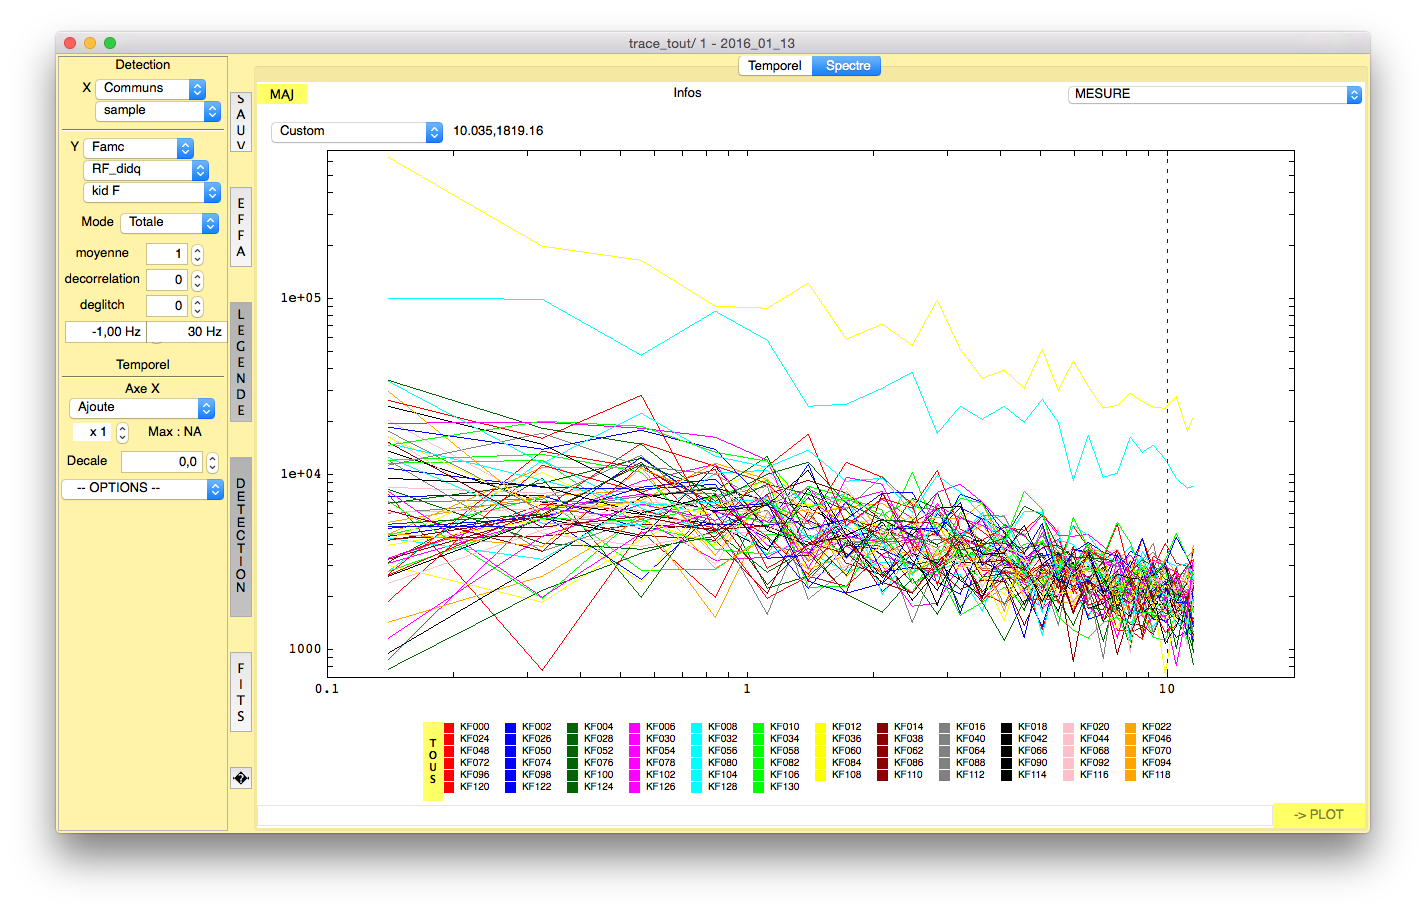
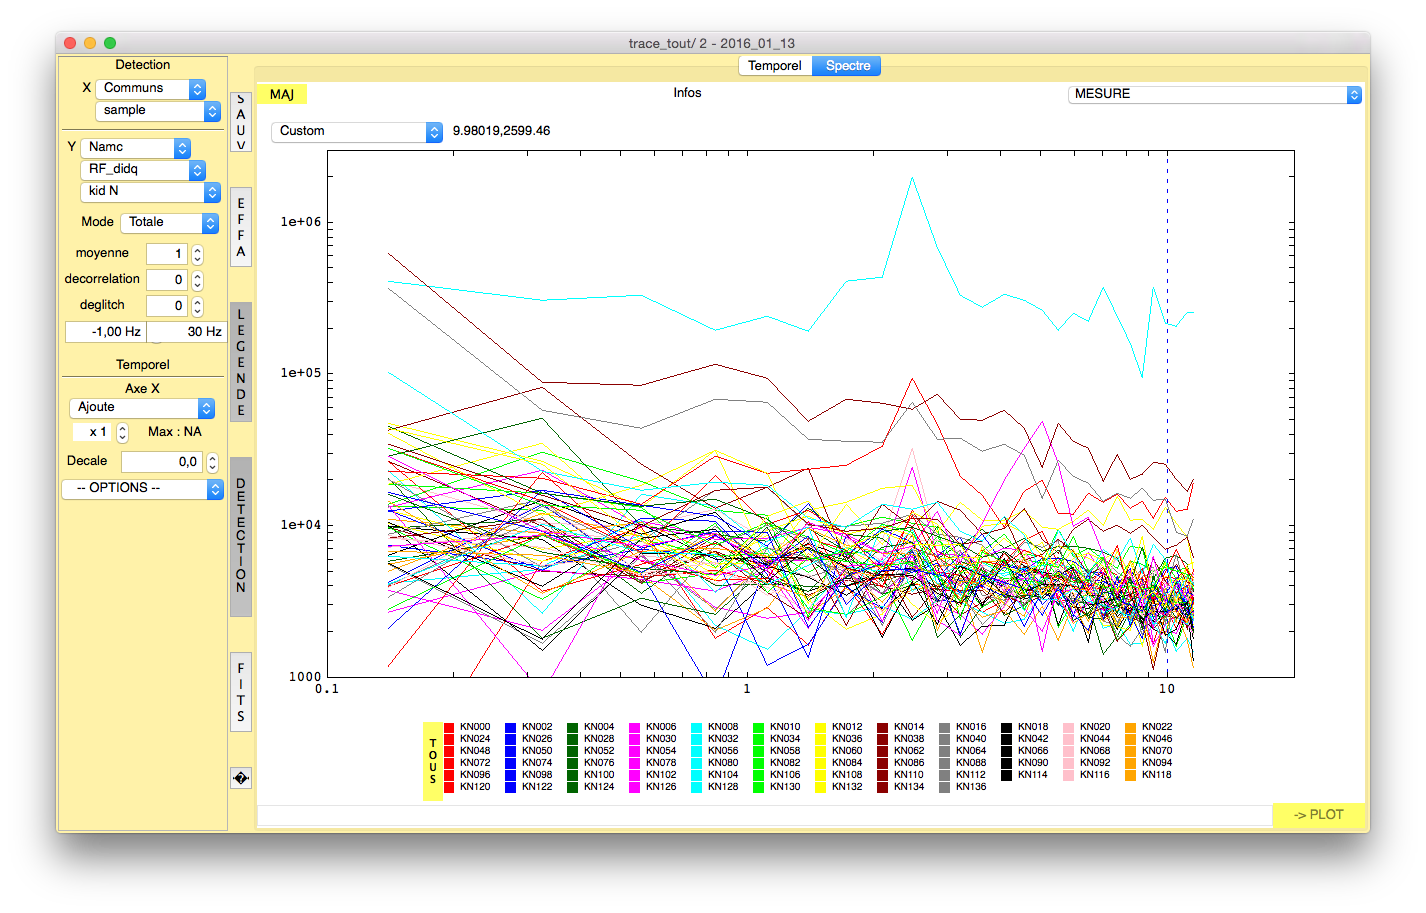
Figure. Noise with the window on respectively the 2mm, 1mm NIKEL_RF (array 1) and 1mm NIKEL_DC (array 3)
![]()
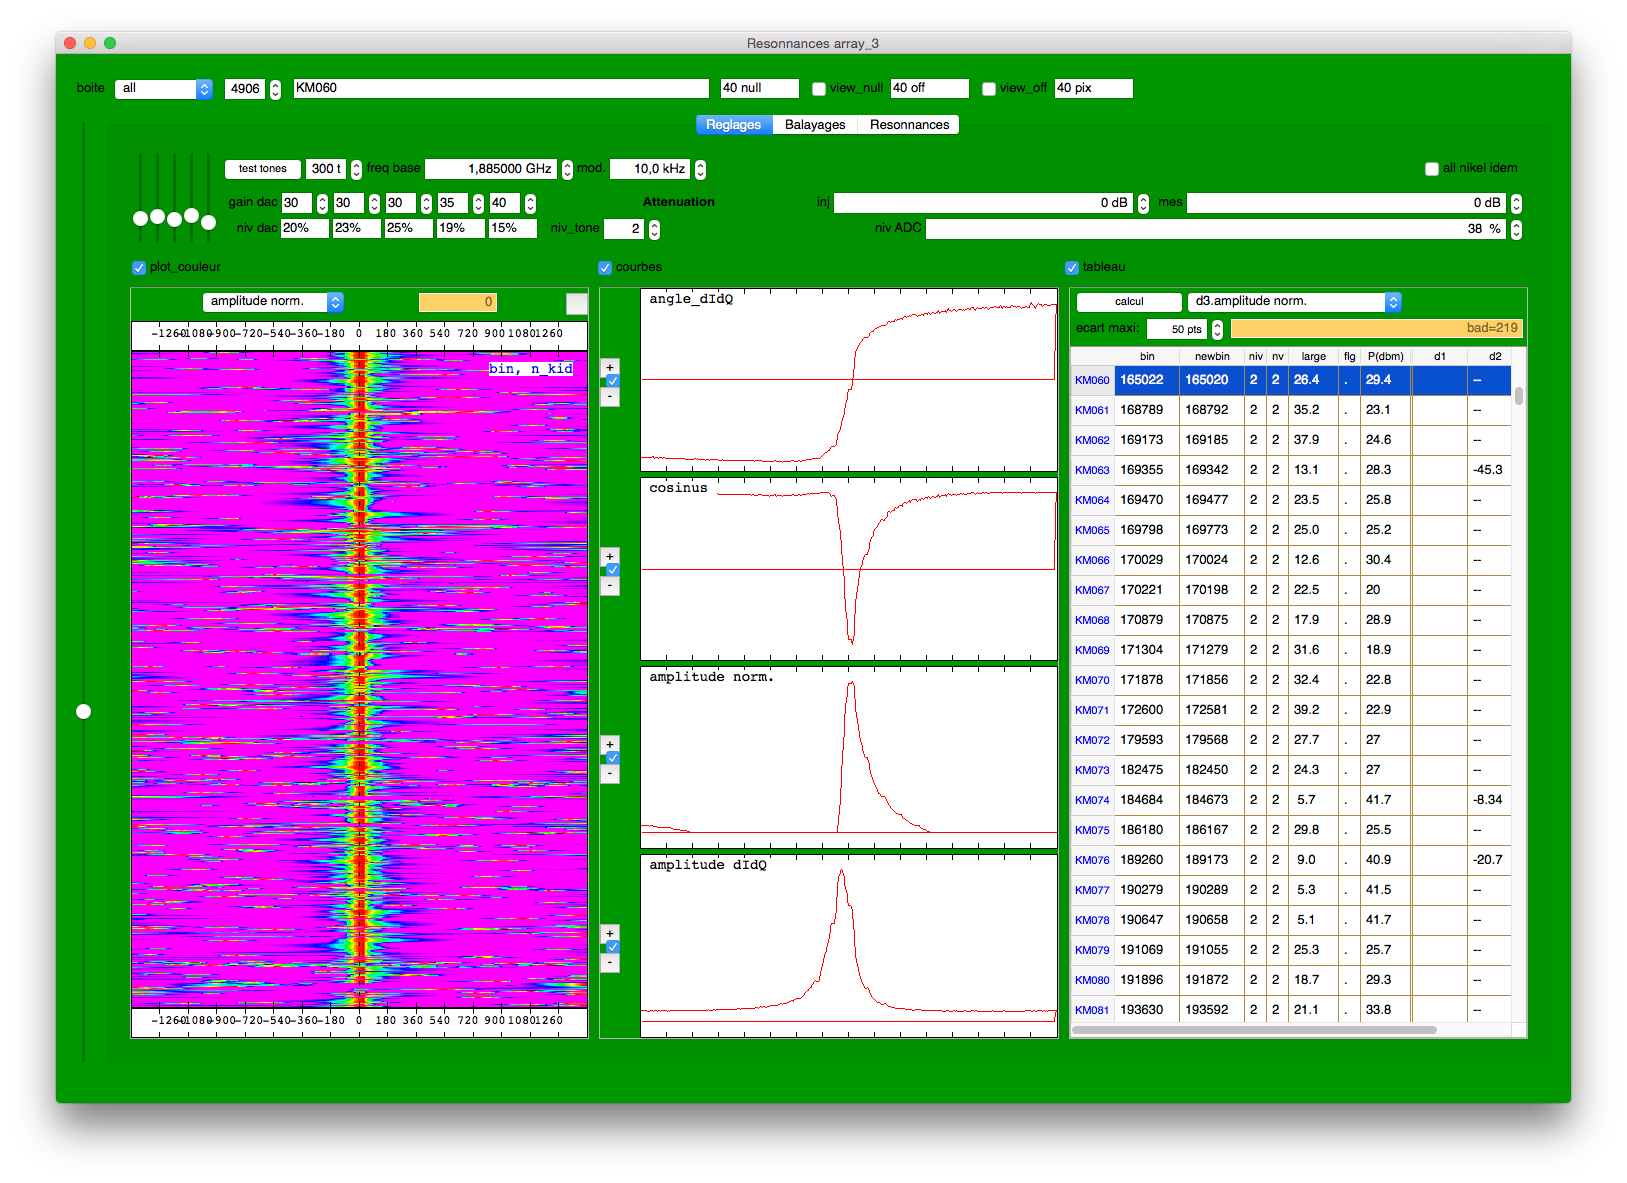
Figure. Left: trace of the 1140 pixels of array 3; right: monitor with all the 20 boards tuned.
Next step on the sky at 2am to check resonances shape.
January 2016, 12 (Tuesday)
- Olivier, Alessandro and Florian arrived at the telescope.
The new boards installed and connected
Array 1 (1mm - IN-OUT 5-12): NIKEL_RF (192.168.1.150)
Array 2 (2mm - IN-OUT 1-4): NIKEL_USB (192.168.1.221-24)
Array 3 (1mm - IN-OUT 13/20): NIKEL_DC (192.168.1.170)
