|
Size: 748
Comment:
|
Size: 1054
Comment:
|
| Deletions are marked like this. | Additions are marked like this. |
| Line 3: | Line 3: |
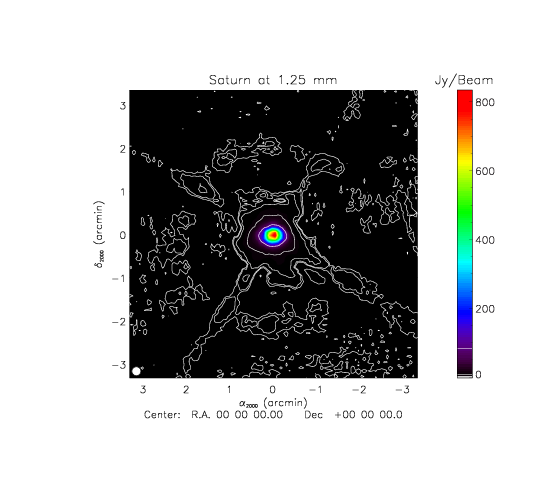
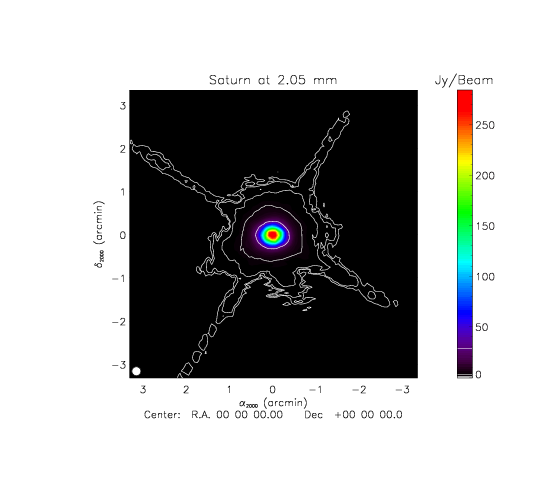
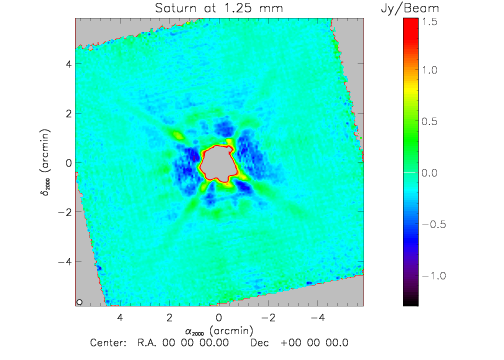
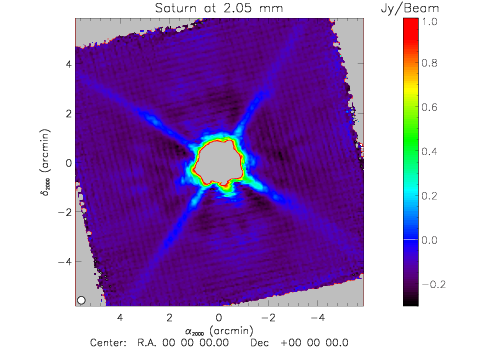
| == Maps of Saturn at 1.25mm and 2.05 == .The contours shown correspond to 1/10, 1/100, 1/1000 and 1/10000 of the maximum of the map |
== Maps of Saturn at 1.25mm and 2.05mm == .The contours shown correspond to 1/10, 1/100, 1/1000 and 1/10000 of the maximum of the map (which is not well calibrated) |
| Line 10: | Line 10: |
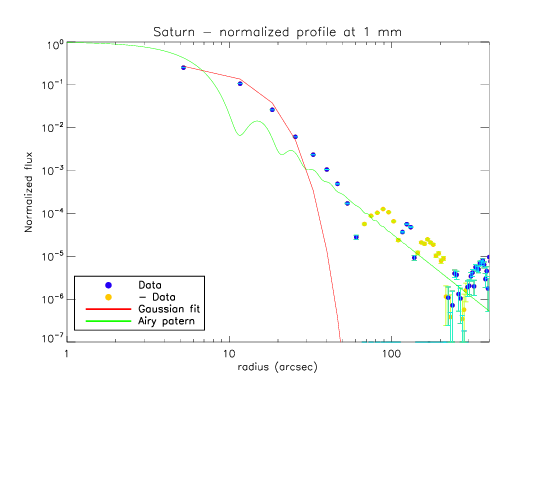
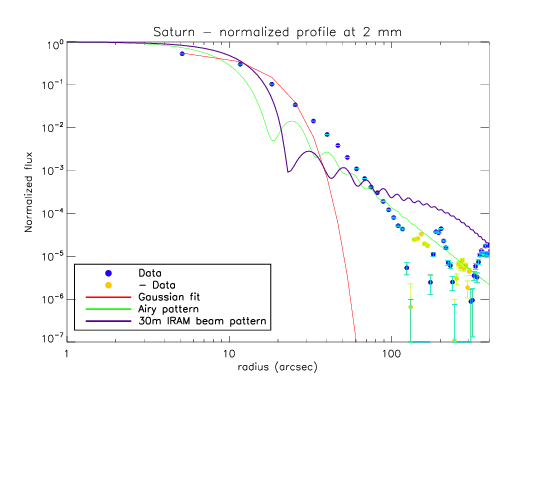
| == Beam profiles at 1.25mm and 2.05 == |
== Beam profiles at 1.25mm and 2.05mm == .The yellow dots are data points that are negative but for this log plot, we show their absolute value |
| Line 15: | Line 15: |
| == Far side lobe at 1.25mm and 2.05 == | == Far side lobe at 1.25mm and 2.05mm == |
| Line 20: | Line 20: |
== In log scale == || {{attachment:1mm_satmap.png}} || {{attachment:2mm_satmap.png}} || || [[attachment:1mm_satmap.pdf]] || [[attachment:2mm_satmap.pdf]] || |
Beam study using Saturn observation
Maps of Saturn at 1.25mm and 2.05mm
- The contours shown correspond to 1/10, 1/100, 1/1000 and 1/10000 of the maximum of the map (which is not well calibrated)
Beam profiles at 1.25mm and 2.05mm
- The yellow dots are data points that are negative but for this log plot, we show their absolute value
Far side lobe at 1.25mm and 2.05mm
- The cross correpond to the arms of the secondary miror of the telescope.

