Short photometric analysis of the last night of observations (FXD)
Goals
- This is a preliminary photometric analysis of a sample of scans obtained during the last hours of run. The opacity went down at that time. The beam came close to the diffraction limit. The offline processing software has been largely tested on Run5 and has been quickly fixed to adapt to the new Lissajous scans on point sources. The taumeter is used for opacity correction with a nu^2 scaling between the 1.2 and 2.1mm channels (soon to be updated with the NIKAtau).
NIKA observations
Day: 18/06/2013
Scans: Lissajous of 5 min on secondary calibrators and otfgeom (12min) for Uranus
Size of the Lissajous pattern: 90"x90"
Size of the map': 180"x180"
Opacity at 225 GHz: 0.2 (0.4 for Uranus otfgeom)
Elevation of the sources: 40-60 deg
First the primary calibrator is set at
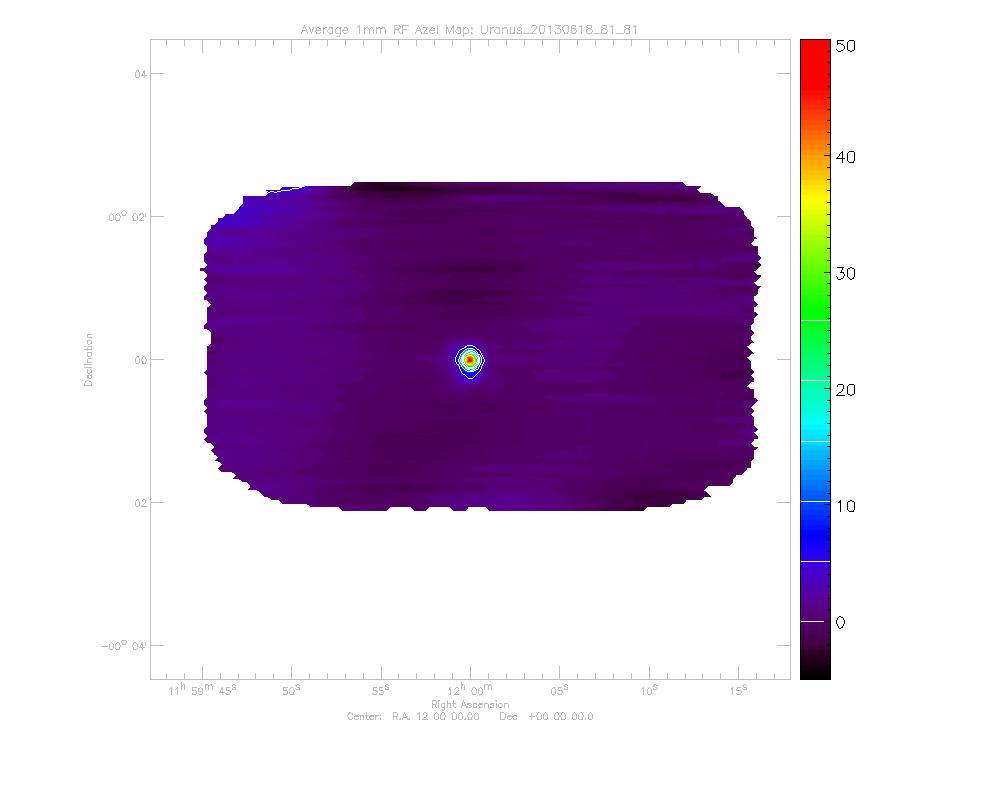
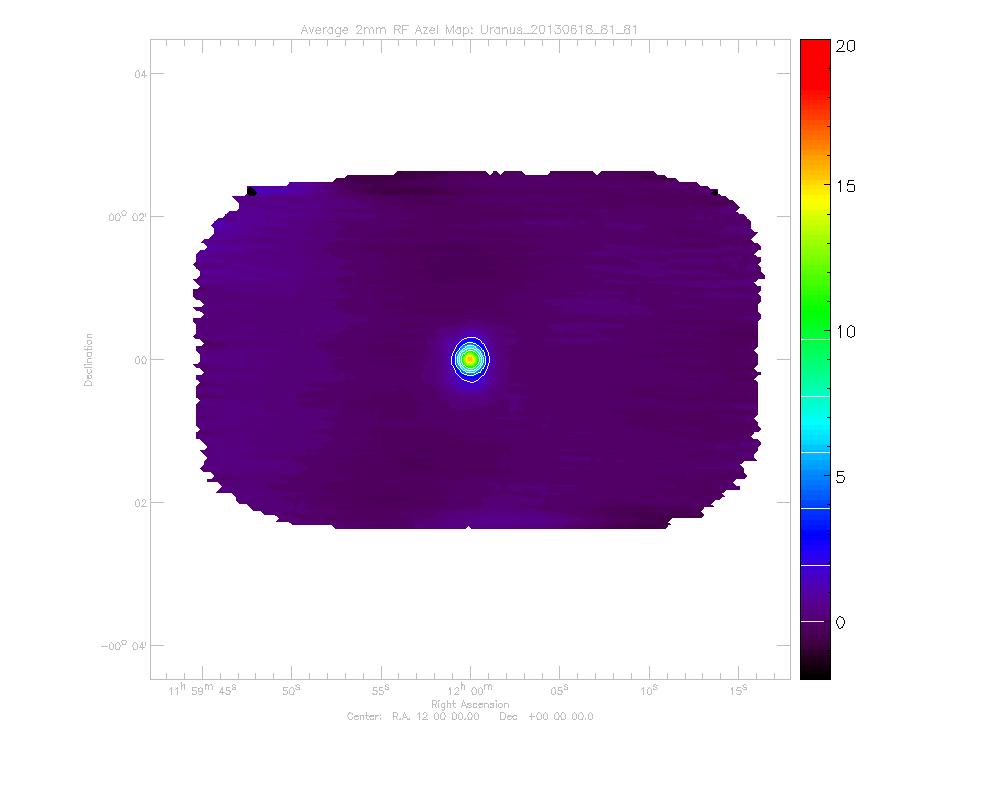
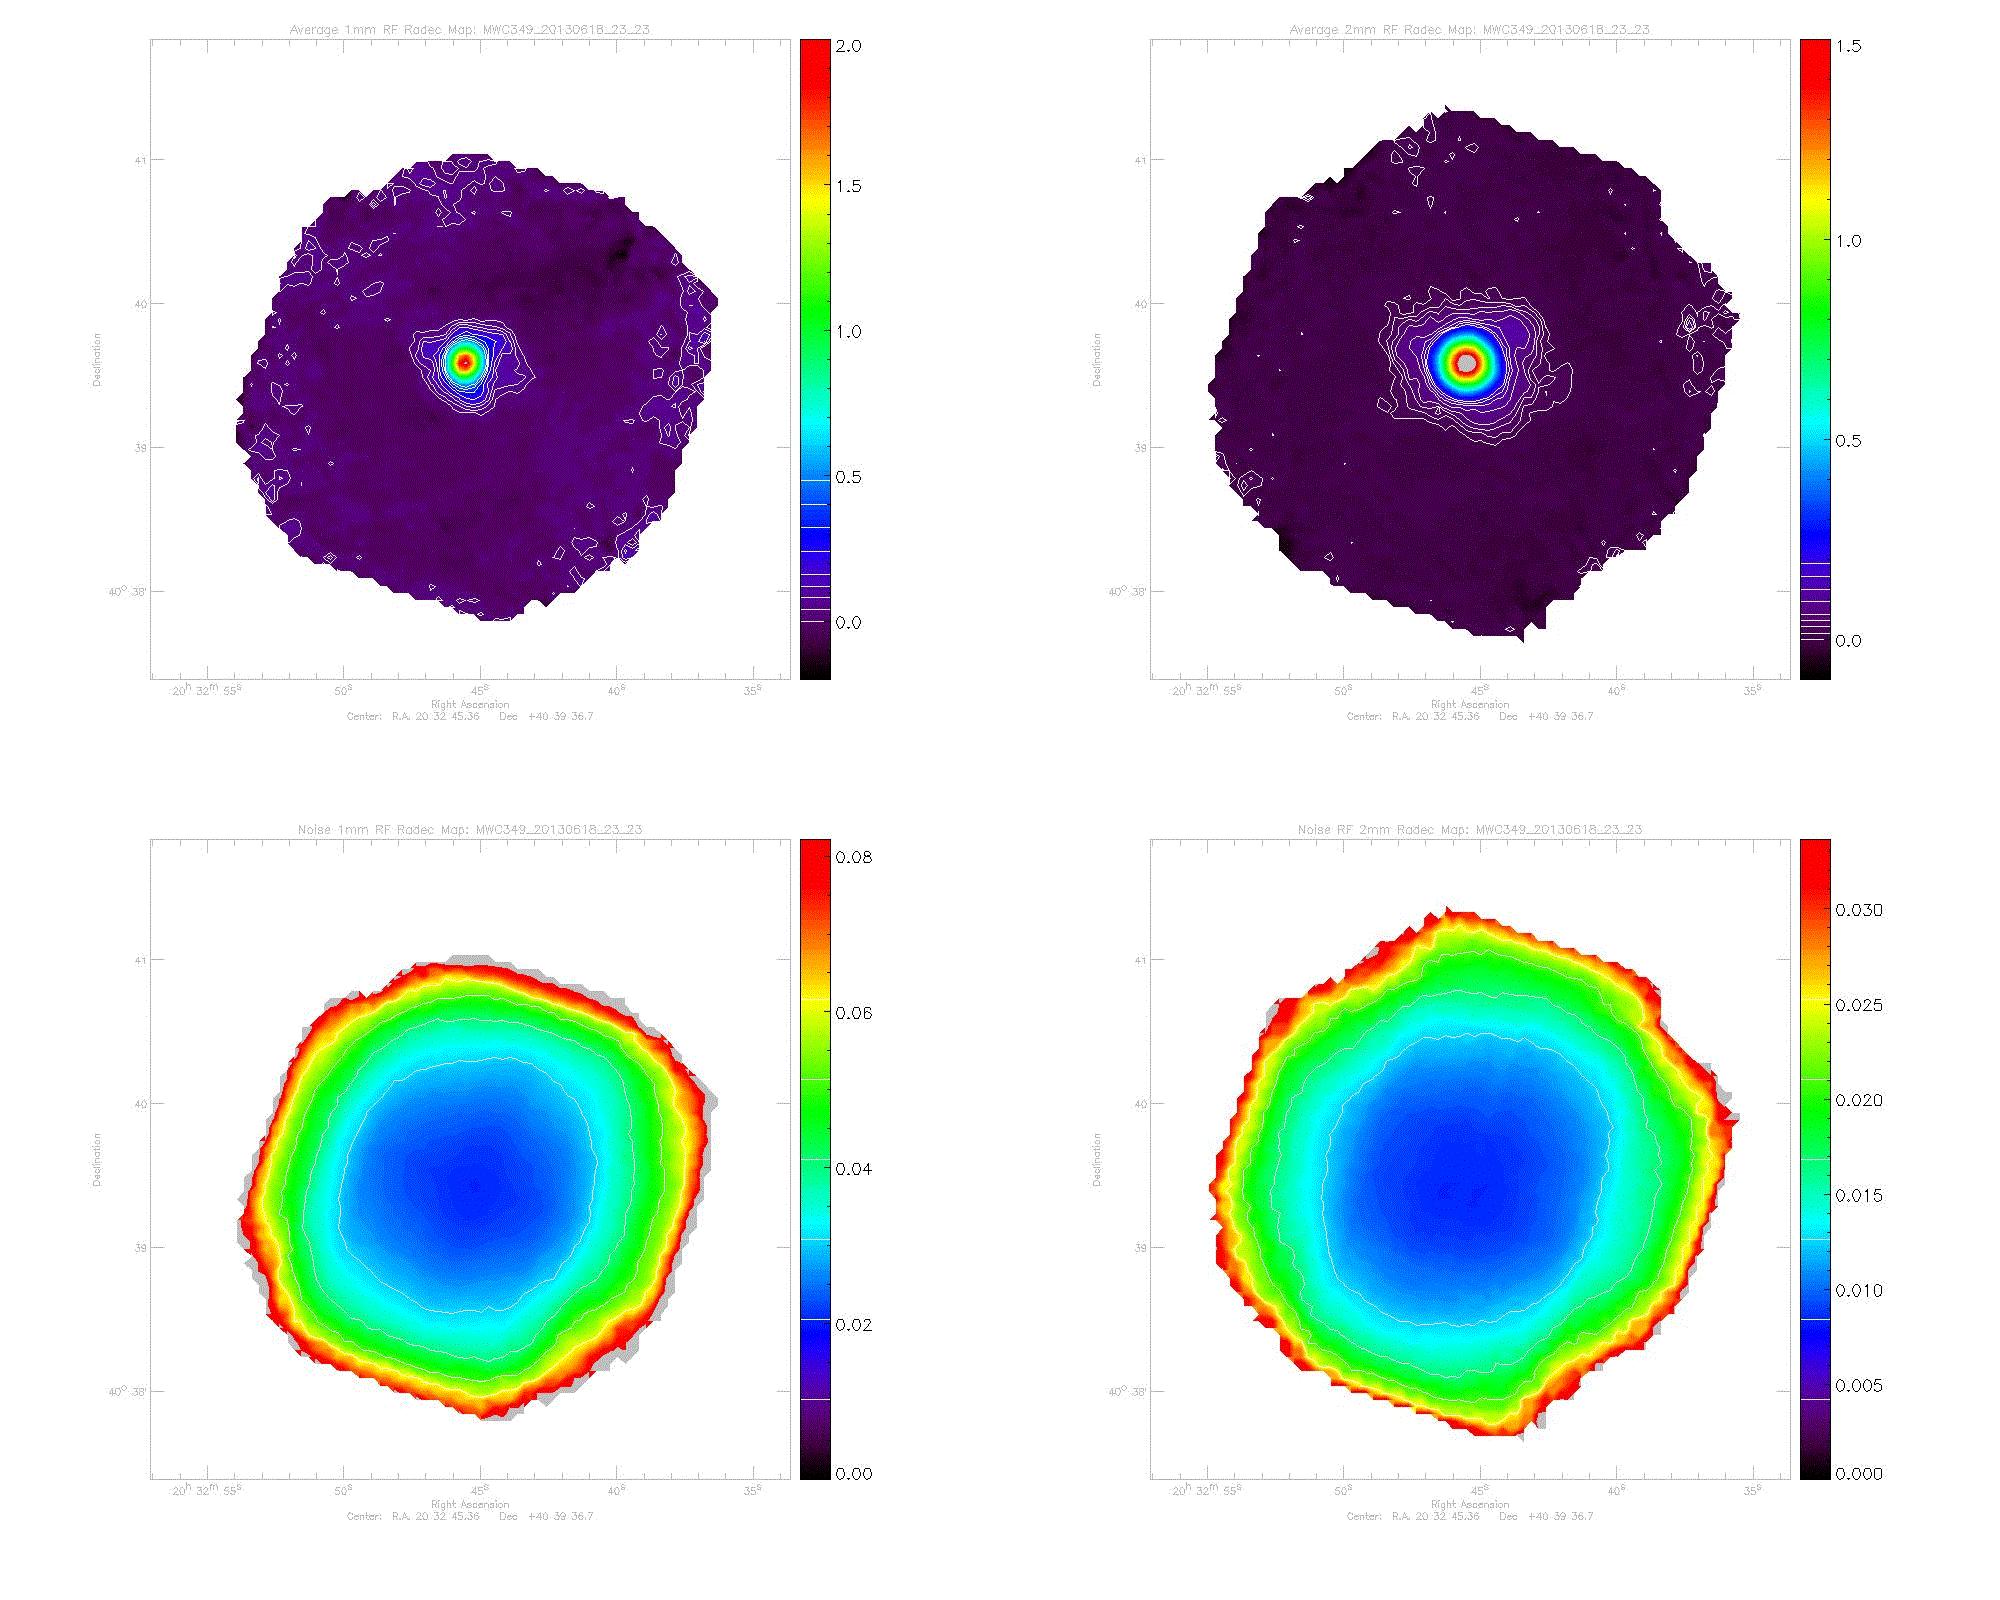
We observe each source at both wavelengths, shown on the maps given below. Contours are at 1,2,3,4,6,8,10 and 12 sigma.
Noise estimates:
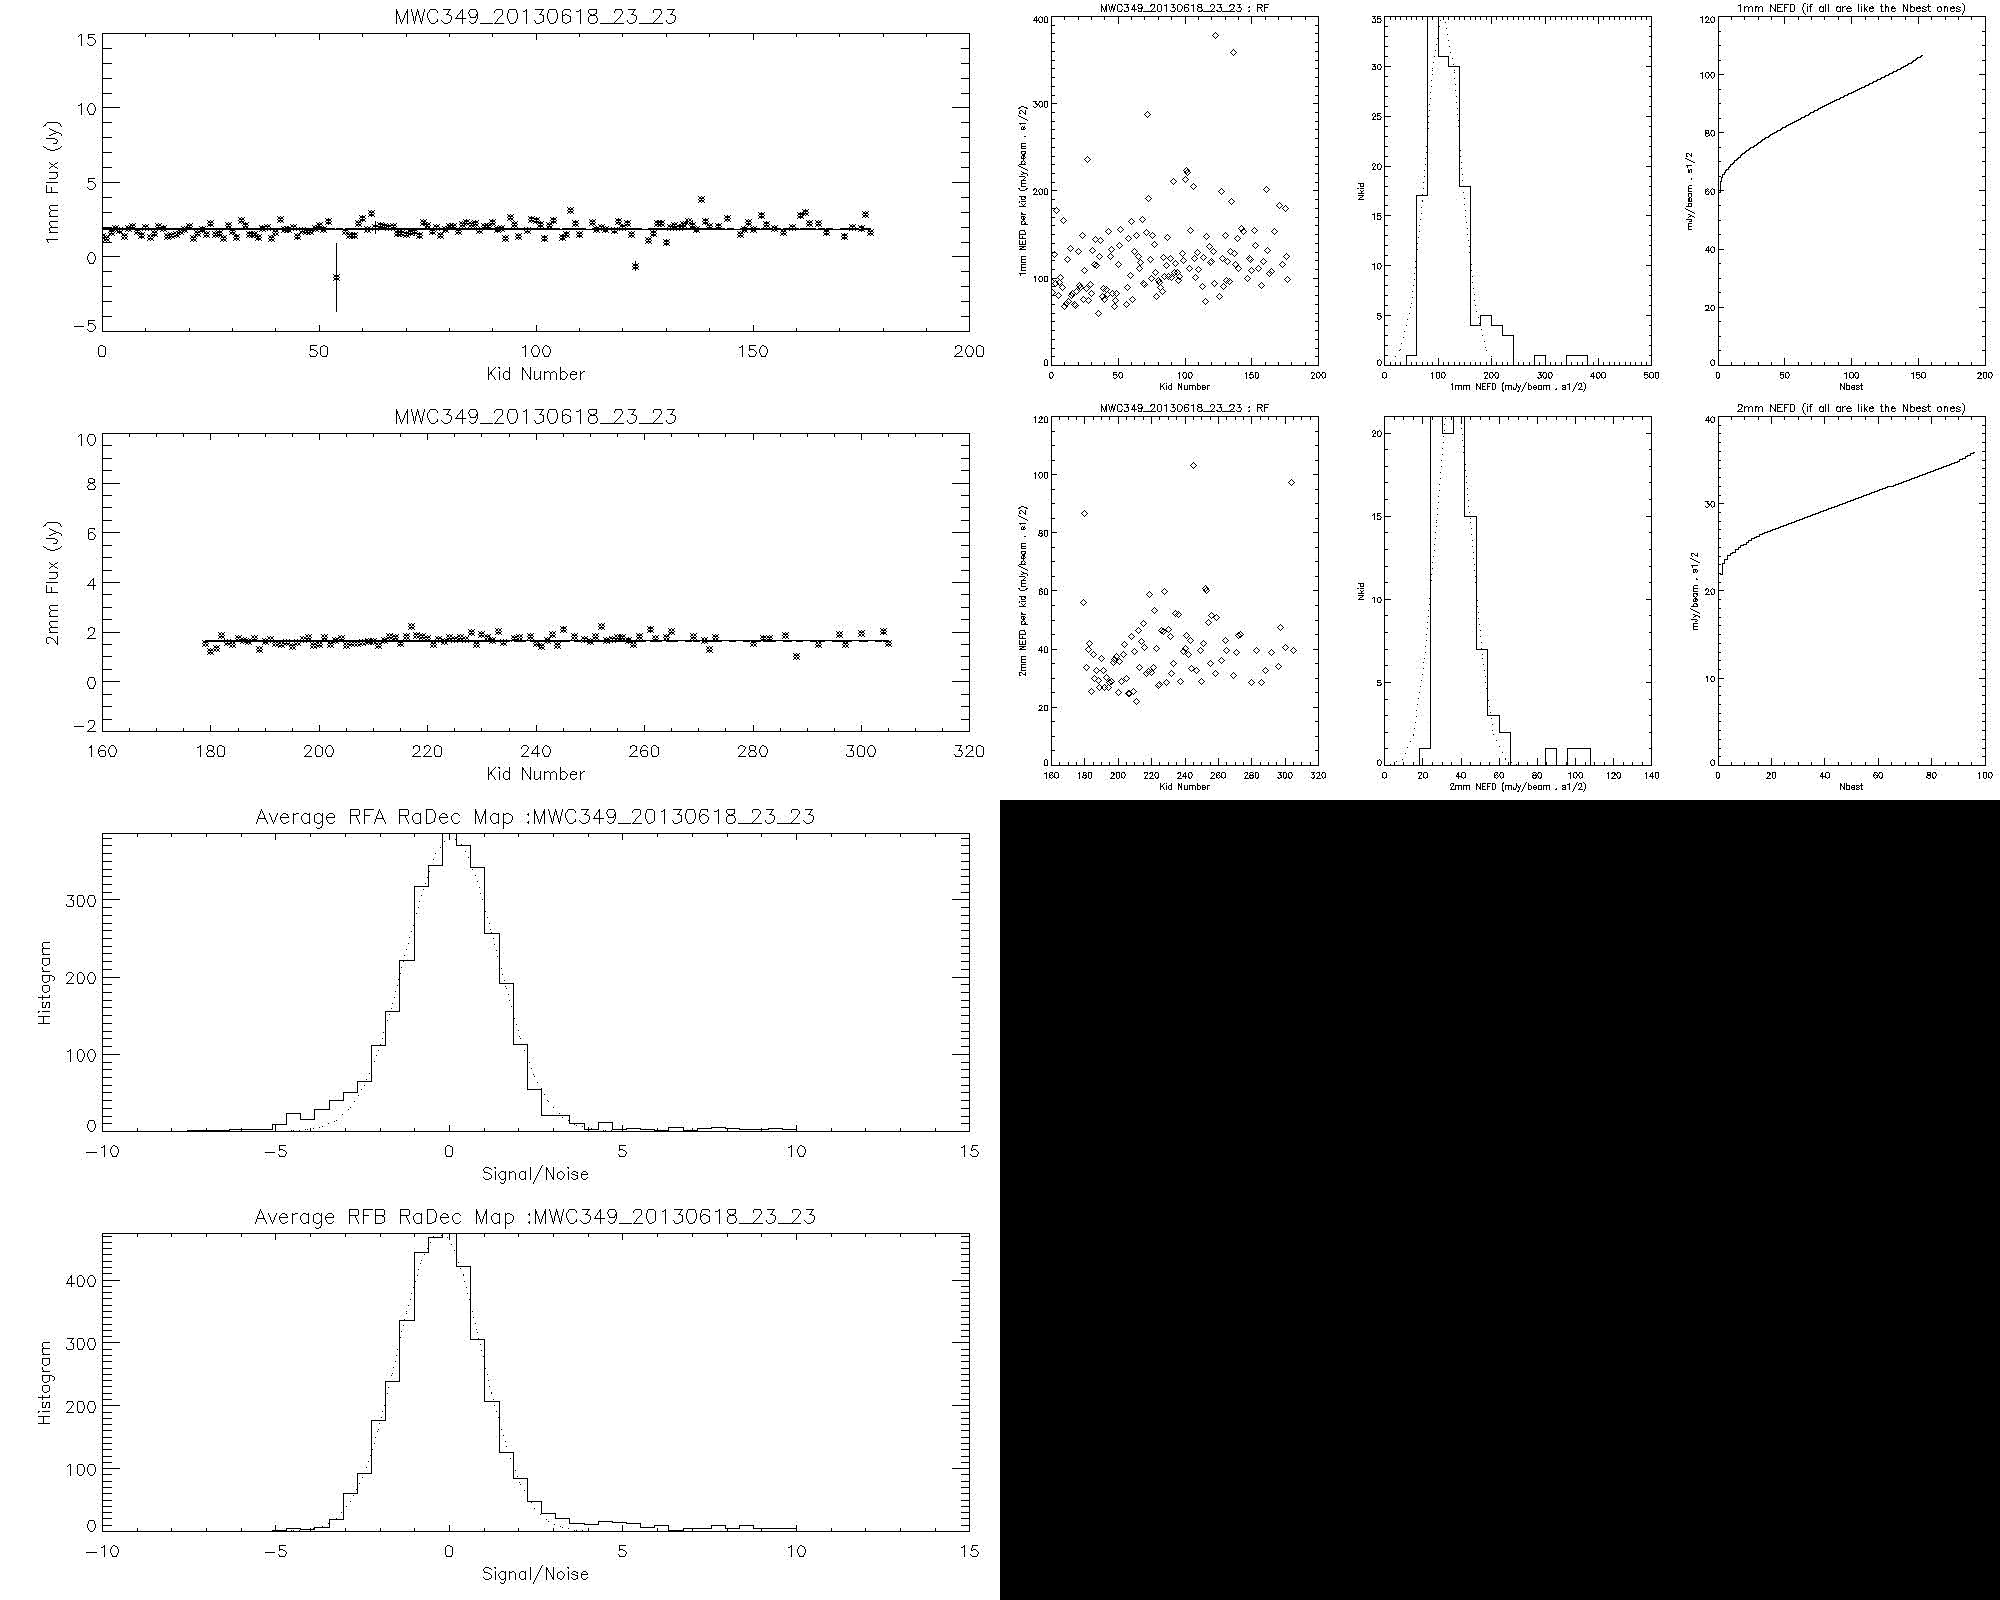
- By multiplying the Jack-Knife maps with the square root of the time per pixel maps and computing the histogram of the obtained map, we are able to estimate the noise level in the data. Note that this is in the case of high opacity (we can expect the noise to be reduced by a factor of about exp(-tau/sin(elevation)) ~ 1.5-2, and even more since the resonances are larger under large optical load).


