Statistics on the Mambo bolometers
Contents
Back to MamboWebPage
Sensitivity
To analyze the sensitivity we computed the distribution of the noise from the winter 2003-2004 pool by normalizing to 1sec. This is a preliminary study assuming that before the switch to the NCS the onOff scans were of 200 s and after of 1200s. Before the NCS the scans were as well sometimes of 160s, leading to an overestimation by 12 % of the noise.
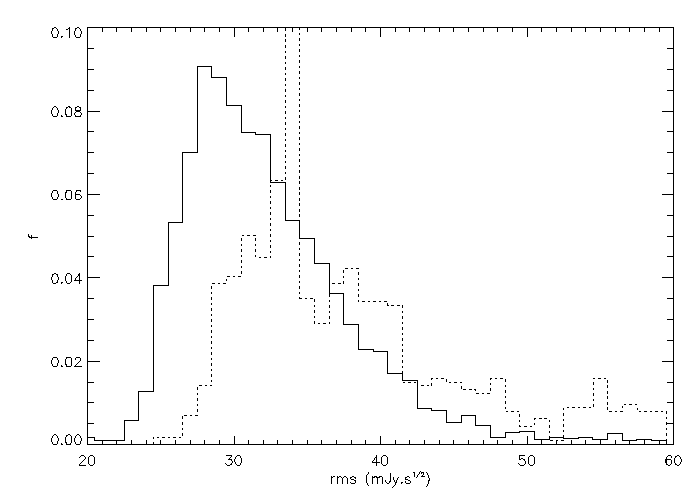
We split the distribution of the 1sec noise for the OCS and NCS period (see Fig. 1). The comparison between both periods does not take into account any weather informations. We only compute the median rms noise achieved in 1sec by an onOff observation using the most sensitive pixel of the bolometer array.

Fig. 1: Distribution of the real sensitivity for 1sec for the onOff merasurements during the OCS (solid line) and NCS (dashed line) period. The OCS rms noise is overestimated since all the scans are assumed to last 200s when some of them are actually of 160s (12 % difference).
The results are given in the Table 1. The loss in sensitivity occurred for the onOff measurements is about 10 % between both periods. This noise rms includes all the observing/data reduction factors (atmosphere, antenna, bolometer, data processing).
Table 1: Statistics of the rms noise for 1sec during the OCS and NCS period of the pool (winter 2003-March 2007).}
Noise Statistics
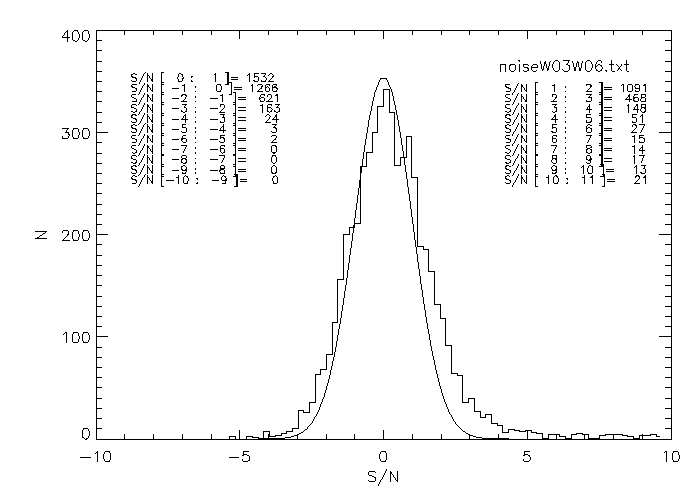
We studied the noise statistics on the on-off measuremens using the data from the winter 2003 until the current pool for winter 2006-2007 (see Table 2). The SNR histogram of the 5923 onOff measurements is shown on the Fig. 2. The positive tail shows the detections even at very low sigma (0-2) but statistically detected. A Gaussian curve is plot over the histogram and shows that the statistic is not exactly Gaussian. To estimate the significance of a detection we compute the probability P(>sigma) of a detection above a SNR sigma using the distribution F(x) on the negative side which has no physical meaning and is less contaminated by the faint sources:


Fig. 2: Distribution F(x) of the SNR for the onOff measurements reduced by mopsic from the winter 2003-2004 until the current pool of the winter 2006-2007. The number of measurements per SNR range are indicated from SNR -10 until 10.
Table 2: Scan number for the on-Off measurements with \mambo. Note that an OnOff scan lasts 1200s since Winter 05-06 vs. 200s before. The double horizontal lines separate the OCS and the NCS.
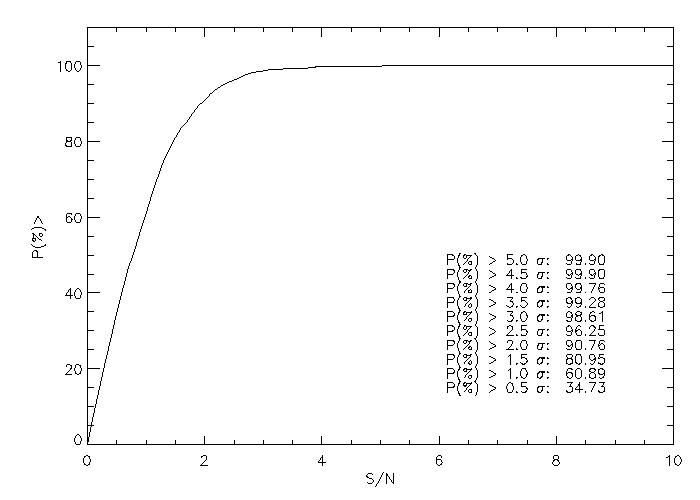
The significance P is shown on the Fig. 3 and appears to be only slightly different from a Gaussian distribution. We checked as well that the statistics did not change strongly over the last 4 years for each pool session.

Fig. 3: Probability of detection (in \%) for an observation with a SNR sigma